Satellites for Global E-Finance and News
Posted on | May 17, 2025 | No Comments
“We choose to go to the moon in this decade and do the other things — not because they are easy, but because they are hard.”
– President John F. Kennedy, September, 1962 [1]
I found a chapter, “Satellites for Global E-Finance and News,” in my Document file for work I was doing on technology and the internationalization of money, particularly in the realms of finance and news. It traces the development and impact of satellite technology on international communications, primarily from the 1960s to the late 1980s. So I ran it through Google’s Gemini 2.5 AI and asked it to summarize. I edited it and posted it below.

telecommunication-satellites
The chapter demonstrates how satellite technology, driven by the demands of globalizing finance and the need for rapid news dissemination, navigated regulatory hurdles and technological advancements to become a crucial component of international communication infrastructure by the late 1980s. The chapter highlights the interplay between political decisions (deregulation), technological innovation (more powerful satellites, VSATs), and economic forces (the growth of global finance and media) in shaping this transformative period.
Inspired by John F. Kennedy’s vision of landing a man on the Moon and enabled by the space program and the Communications Act of 1962, Intelsat was formed, leading to the first global satellite communication system. Live broadcasts, especially the 1964 Tokyo Olympics, demonstrated its potential to the US and the world.
At the time, satellites had some significant advantages over undersea cables. They offered geography-insensitive connectivity, bypassing national terrestrial infrastructures and enabling point-to-point, point-to-multipoint, and broadcast transmissions. Fiber optic cables now provide much more capacity and speed, but satellites have become more sophisticated, especially new designs like SpaceX’s Starlink.
Satellites had a significant impact on the globalization of electronic finance. The end of the Bretton Woods agreement in the 1970s spurred the growth of electronic currency exchanges, which relied heavily on satellite data communication for financial news and transactions. The liberalization of the global financial and telecommunications regulatory environment allowed satellites to facilitate borderless commerce and e-money. This digital globalization led to the resurgence of the US dollar as the world’s reserve and trading currency.
Deregulation in the US helped propel new services. The 1972 Domestic Satellite Decision (“Open Skies”) was a crucial step in deregulating the US telecommunications system, allowing new companies to enter the satellite service market and setting a precedent for further deregulation. [2]
The Apollo space project spurred the development of stronger rockets and miniaturization of electronics, leading to larger and more sophisticated satellites like the Intelsat IVA with over 6,500 voice circuits and 2 TV channels by the mid-1970s (up from 240 voice circuits in Intelsat I). Satellites also began supporting packet-switched data communications thanks to the Alohanet and other networking projects.
Satellite communications became vital for electronic money and news flow. Cheaper long-distance telephone service, live broadcasting of major sports events, and faster news footage transmission from remote locations became possible. Newspapers like the Wall Street Journal saw significant benefits, reducing transmission costs from $3,500 per day to $90 and increasing plant productivity from 25,000 to 70,000 copies. Dow Jones’ revenues increased from $156 million in 1971 to $531 million ten years later.
Satellite technology facilitated the rise of global news networks like PBS (reaching 179 earth stations by 1984) and CNN (launched in 1980), enabling live, continuous news coverage from anywhere in the world. ABC’s Nightline exemplified this trend by its reporting on the Iranian hostage crisis and later the Tiananmen Square uprising in China. Hosted by Ted Koppel, the program conducted remote interviews with people such as UN Secretary-General Boutros Boutras Ghali. It combined the long distance service with some new studio technology and in the process developed a new form of news coverage that caught on quickly around the world.[3]
Europe also recognized the importance of space-based communications, forming the European Space Agency (ESA) in 1973 and developing the Ariane rocket, which became a primary launch vehicle, especially after the 1986 Challenger space shuttle disaster. I had a chance to visit the ESA’s European Space Research and Technology Centre (ESTEC) in Noordwijk, Netherlands in 1990 while visiting my uncle. It was while writing my PhD on electronic money and helped shape my thinking.
Satellite Business Systems (SBS) was formed by a joint venture between Aetna, Comsat, and IBM and aimed to provide high-speed data communications (45 megabits per second) for corporations. Despite technical capabilities (SBS-1 had a capacity for 1250 two-way telephone conversations per channel and 10 simultaneous color television transmissions with an average data rate of 480 megabits per second), SBS faced challenges due to the emergence of the X.25 protocol and the high cost of earth stations. It was eventually sold off.
Intelsat expanded rapidly, despite facing emerging competition. It launched its Intelsat V series in the mid-1980s, supporting both C-band and Ku-band frequencies and offering a wide range of services to 174 countries by 1987. Its International Business Services (IBS) catered to major international corporations.
In the early 1980s, the Reagan administration pushed for the deregulation of international satellite communications, challenging Intelsat’s monopoly. The FCC allowed new US International Service Carriers (USISCs) and open ownership of earth stations.
Deregulation also led to competition in launch vehicles. The NASA Space Shuttle program initially boosted the satellite industry by providing a reusable launch vehicle. However, the 1986 Challenger disaster led to a temporary halt and a shift towards privatization of launch services, allowing European (Ariane) and Chinese (Long March) rockets to gain market share.
Concerns arose regarding the limited resource of the geosynchronous orbit, conceptualized by Arthur C. Clarke. (see below) This shortage led to monitoring and regulation by the International Telecommunications Union (ITU), primarily using a first-come, first-served principle, although political pressures for a registration system emerged.

Overall, “Chapter 12” “Satellites for Global E-Finance and News,”
explores how satellite technology evolved from the 1960s to the late 1980s to become a foundational infrastructure for global finance and news media. It illustrates the interaction between technological innovation, regulatory reform, and globalization, focusing on how satellites enabled real-time, transnational communication crucial for electronic money systems and financial journalism.
Citation APA (7th Edition)
Pennings, A.J. (2025, May 17) Satellites for Global E-Finance and News. apennings.com https://apennings.com/global-e-commerce/satellites-for-global-e-finance-and-news/
Notes
[1] Quote from JFK was from a speech given at Rice University in Houston Texas to dedicate NASA’s new Manned Spacecraft Center, 22 miles away.
[2] I always found Rob Frieden’s work on the FCC and international communications technology to be particulary useful. Parsons, P.R and Frieden, R.M. (1998) The Cable and Satellite Television Industries. Needham, MA: Allyn and Bacon. p. 52. Tim Logue, as well. Logue, Timothy “Recent Major U.S. Facilities-Related Policy Decisions: Letting a Million Circuits Bloom,” In Wedemeyer D. and Pennings, A. (eds.) Telecommunications-Asia, Americas, Pacific: PTC’ 86 Proceedings. p. 81.
[3] Hansen, Jarice. (1994) Connections: Technologies of Communication. New York: HarperCollins College Publishers. p. 162.
© ALL RIGHTS RESERVED
 Anthony J. Pennings, PhD is a professor at the Department of Technology and Society, State University of New York, Korea and a Research Professor for Stony Brook University. He teaches AI and broadband policy. From 2002-2012, he taught digital economics and information systems management at New York University. He also taught in the Digital Media MBA at St. Edwards University in Austin, Texas, where he lives when not in Korea.
Tags: Domestic Satellite Decision > Nightline > Open Skies > SA's European Space Research and Technology Centre > SBS > US International Service Carriers (USISCs)
Determining Competitive Advantages for Tech Firms, Part 1
Posted on | May 14, 2025 | No Comments
Is the world more competitive for tech companies? Globalization has expanded market reach and access to talent, while the rapid pace of technological innovation constantly reshapes the competitive landscape. Lower barriers to entry have fostered a vibrant startup environment, challenging established players. The fierce competition for skilled technology talent further fuels this dynamic environment. Rising consumer expectations demand continuous improvements and innovations, and increasing regulatory scrutiny adds another layer of complexity. Finally, geopolitical factors significantly influence the global technology market and its supply chains. Working in concert, these forces have created a highly competitive arena where technology companies must constantly adapt and innovate to survive and thrive.
This post reworks one of two previous blogs that analyzed The Curse of the Mogul: What’s Wrong with the World’s Leading Media Companies by Jonathan A. Knee, Bruce C. Greenwald, and Ava Seave. I used it as part of the Digital Media Management curriculum at New York University and the Digital Media MBA at St. Edward’s University in Austin, Texas. It stresses the importance of substantial barriers to entry, or conversely, competitive advantages, for success in what economists call the “market structure” of a particular product.
The Curse of the Mogul emerged at a time when digital media firms were first starting to wrestle with the Internet. I draw on this book and other sources to continue to stress the importance of firms building strong barriers to entry in competitive economic environments. I changed the focus from digital media to tech companies in line with the changing vernacular and a shift in power to edge computing companies using AI and e-commerce.
The authors of Curse of the Mogul argue point out that companies should focus on developing and reinforcing more serious competitive advantages and/or operational efficiencies (disciplined management of resources, costs, and capital allocation).[1] They were critical of media mogul’s preoccupation with topics like brands, deep pockets, talent (creative, managerial), a global footprint, and first-mover benefits. These points are relevant but obscure other business factors that would likely facilitate better results.[2] Successful tech companies must define and protect more structural barriers to entry or adopt strict cost control procedures and operational efficiencies to enhance productivity and profitability.
Market structure has become a key focus of strategic thinking in modern firms. It refers to the environment for selling or buying a product or product series and influences key decisions about investments in production, people, and promotion. It is primarily about the state of competition for a product and how many rivals a company will have to deal with when introducing it. How easy is it to enter that market? Will the product be successful based on current designs and plans for it, or will the product need to be changed? How will the product be priced? Market structure is impacted by technological innovations, government regulations, network effects, customer behaviors, and costs.
Key factors include the number of firms supplying product, the level of differentiation between products offered, and the main focus of this post – the competitive advantages or barriers to entry that a company can erect to bolster their position or stave off competition. The pricing strategy can also be a factor but that is largely dependent on the level of competition.
In light of the rapid development and convergence of these tech and digitally-based industries, it is worth exploring the areas of key focus for the authors. In this post and the next, I review some of the major sources of competitive advantages according to The Curse of the Mogul and reference how they might apply to digital media firms. The book refers primarily to traditional big media firms. How do these categories of competitive advantage apply to a wider group of digital firms?[3] The authors distinguish four categories:
- Economies of scale and network effects;
- Customer captivity;
- Cost; and
- Government protection.[4]
Due to space constraints, I will cover economies of scale and customer captivity in this post and cost, innovation, and government protection in a future one.
Economies of Scale
This is a central concept in economics and refers to the benefits that come to a firm when it becomes more effcient. It may involve fixed costs or network effects. Fixed costs refer to both the traditional sense of decreasing costs per unit produced as well as to the barriers created by a company like Google with the ability to spend lavishly on equipment, knowledge attainment and other factors that make it prohibitive for other firms to match. Steven Levy’s “Secret of Googlenomics: Data-Fueled Recipe Brews Profitability” on the Wired website provides an excellent introduction to the search behemoth’s business model, primarily built around its Adwords and Adsense advertising business.
Google has a number of advantages, perhaps foremost being the massive investments in its built infrastructure. Google’s mission requires more than the most sophisticated “big data” software, it necessitates huge investments in physical plant, particularly data centers, power systems, cooling technologies, and high-speed fiber optic networks. Google has built up a significant global infrastructure of data centers (increasingly located close to cheap, green tech) and connecting its storage systems, servers, and routers is a network of fiber optic switches. For example, the Eemshaven data center facility in the Groningen region of the Netherlands is at the end connection point for a transatlantic fiber optic cable.
Large firms like Google can spread their fixed costs over greater volumes of production and operate more profitably than their competitors. For the most part, the details on fixed costs are not readily available as they are proprietary and represent trade secrets. However, aggregate numbers of Google’s fixed costs are informative.
Near Zero Marginal Costs
One of the characteristics of digital media is that although initial production costs may run high, the costs for additional viewers to experience the resulting digital content – movie, television show, software, song, or video game are negligible. Most digital goods can experience near-zero marginal costs. This advantage has been challenged in the age of Artificial Intelligence (AI) however, as the “compute” needed to produce results requires significantly more energy than traditional search.
Economies of scale for book publishers have always meant they needed to cover their fixed costs such as editors and author royalties before they can achieve profits. However, if they have a bestseller, it can be quite profitable as they spread their costs over a larger production run. Digital distribution through Amazon’s Kindle or Apple’s iBooks not only reduces the costs of production, but as no ink or paper is involved, it significantly reduces the costs of delivery as well. This happens for software as well. Microsoft Office, for example, which contains Access, Word, Excel, and PowerPoint, can be distributed over the Internet with little expense. But that is not necessarily a competitive advantage. Digital assets also need to be protected from copying and other forms of theft, and they need to utilize network effects and viral marketing.
Network Effects
Network effects refer to the increasing value of a product or service that occurs when additional customers or users start to use them. Many communications technologies such as telephones, fax machines, and text applications exhibit direct network effects. The telephone system became more valuable to each individual telephone subscriber as more people connected to the phone system. When more mobile phone users started to take advantage of Short Message Service (SMS) or “texting,” it attracted even more users. When I got my first text from my sister, for example, who was not known at the time for her technological prowess, I knew that texting had arrived.
Network effects are complicated and may not be sufficient and always be positive, as MySpace discovered after 2008 when members abandoned it for Facebook. MySpace was a social media site that allowed users to create their own “spaces” with pictures, blogs, music, and videos. The darling of early “social networking,” it was sold to Rupert Murdoch’s News Corporation for US$580 million dollars in 2005. Two years later, with 185 million registered users, it had a valuation of $65 billion. By early 2011 MySpace was down to about USD 63 million, while Facebook had jumped ahead with over 500 million members. Tired of pumping money into the sinking ship, News Corp. sold MySpace to Specific Media, an advertising network for $35 million, just 6% of its purchase price.[5] By 2025, Facebook had over 3 billion monthly active users (MAU).
Digital firms need to consider multiple repercussions such as cross-network and indirect network effects. The authors use the example of eBay, an online auction company that benefits from cross-network effects. eBay, Uber, Airbnb, and many other “platforms” such as dating or recruiting sites are also known as two-sided networks because they bring two distinct groups together. As the number of the eBay’s customers increased, it became increasingly attractive for others to sell their wares on the site. Conversely, as more products were displayed, it attracted more customers. A major success for Microsoft Office is that files produced on Word or Excel often need to shared and read by others.
Network effects makes a site or product more valuable as it includes more people and those additional people make it more attractive for another group. Credit cards, for example, are another good example of cross-network effects. They rely on a large base of individual card holders for profitability and this large customer base than attracts merchants who want their business and are willing to pay the extra costs to the credit card company. This raises questions about who you charge and if a proprietary platform is needed.
Over-the-top (OTT) services that use the Internet as a distribution system, like Amazon Prime, Netflix, and YouTube, connect consumers with content makers. While Prime and Netflix produce considerable content, they draw on outside content producers to keep their viewers engaged. YouTube has drawn heavily on user-generated content (UGC) as does Instagram and TikTok. In each case, the platform’s success depends on its direct network effects – its ability to connect a large number of viewers with a large number of producers.
Another phenomenon is indirect network effects. This occurs when the increasing use of one product or service increases the demand for complementary goods. The standardization of the Windows platform in the 1990s, for example, and its nearly ubiquitous installed user base among PC users allowed many other software producers to thrive as they built their applications to run on the Microsoft operating system. Both Apple and Android-based smartphones have allowed thousands of apps to be added to their functionality. So the network effects attributed to the popularity of these PCs and smartphones carry over to applications that run on them.
Viral Marketing
Viral marketing is a promotional strategy that relies on the audience to organically spread a marketing message to others, much like a biological virus. The goal is to create content that is so compelling, entertaining, or valuable that people will naturally want to share it with their friends, family, and colleagues. The key characteristics of viral marketing include rapid spread, user-driven growth, shareable content, and short-term growth.
Viral marketing’s primary aim is for the message to spread quickly and widely through social networks and word-of-mouth. Viral marketing relies on individuals to share the content, rather than the company paying for extensive distribution. Successful viral marketing campaigns typically involve content that evokes strong emotions, provides utility, or has a novelty factor that encourages sharing. While highly effective at generating initial awareness and a rapid influx of users, the effects of viral marketing can be short-lived if not coupled with other strategies. Examples of viral marketing campaigns include engaging videos, social media challenges like the ALS Ice Bucket Challenge, and creative contests or giveaways.
Key Differences Between Network Effects and Viral Marketing
The main differences between network effects and viral marketing lie in their focus and the source of their power. The primary goal of network effects is to increase product/service value for users, while for viral marketing it is to achieve rapid user acquisition and brand awareness. The main mechanism for network effects is to increase value through the number of users while viral marketing works through the spread of shareable content created by the brand. The driver of network effects are the user connections and interactions. That also powers the sharing of content by individual users, which can feed more users for increased network effects. Network effects grows long-term sustainability and creates competitive advantage based on value production. Viral marketing creates rapid, short-term growth based on content appeal that can provide a temporary boost but doesn’t inherently build firm defensibility unless it results in more captured customers.[7]
Customer Captivity
Maintaining the attention and fealty of customers is often vital to a product’s success and is reinforced through habit, switching costs and search costs. Successfully introducing customer practices and reinforcing habitual use is a crucial strategy for retaining customers. Mobile apps lock users into a much more narrow range of options than surfing the Web on their PCs. Also, Amazon’s One-click purchase option makes it quick and easy to complete the deal without dragging out the credit card and inputting all the numbers and other information.
Speaking of credit cards though, they remain a consistent vehicle to keep a hold of customers through subscriptions and reward programs. Subscriptions use the automatic payments of credit cards to keep making the necessary payments to maintain the continous service or supply of product. Switching costs and reward forfeitures discourage giving up a credit card. Loyalty programs foster perceived value, not always real value. Switching mean may mean losing accumulated points, changing autopay for multiple bills, and potentially hurting one’s credit score due to new inquiries or shorter account history.
One new digital tool that is proving effective is the recommendation engine. Netflix uses a recommendation engine to keep customers engaged. It constantly suggests titles the viewer might be interested in watching based on their previous viewing. Amazon destroyed the Borders bookstore with its recommendation engine and an effective email system that targeted customers with what they wanted. Borders could only offer pictures of loosely associated books with dubious links to the customer’s interests. I, for example, was not interested in their fine collection of Harlequin-like romance novels. Borders did not recommend the books I wanted, so I bought them from Amazon, despite the enjoyment of going to the Borders bookstore.
It is also important to keep customers from switching to competitors. Switching barriers can involve exit fees, learning effort, equipment costs, emotional stress, start-up costs, as well as various types of risk: financial, psychological, and social. Cable and home security companies are notorious for trying to keep customers in long-term contracts to keep them from switching.
Making it easy to learn new products is helpful as is reducing any stresses associated with understanding new features or upgrading. One way to keep customers is to make the payment system easy. Automatic payments work for subscription-based services like Netflix and other deliverers of online content that tie in customers through credit cards and other continuous payment systems.
Search costs encourage consumers to stay with a particular product or entice them to go with your brand if the information provided is convincing enough to cause them to give up their search. Rational consumers will tend to search until the perceived benefits outweigh the costs. Testimonials and good reviews will help alleviate their concerns. Big ticket items like cars, homes, or major appliances tend to require more search time than smaller items. But any search requires a calculation of the opportunity costs involved. What are they giving up to spend this time searching?
In the passages above, I reviewed competitive advantages as specified by the authors of The Mogul’s Curse and applied them to digital media firms. Their focus on moguls doesn’t hold as much interest for me as their discussion about competitive advantages for smaller companies.[4] Being technologically dynamic, the digital media field is still investigating and exploring its ability to create competitive advantages and erect barriers to entry.
It is also important to understand that two or more competitive advantages may be operating at the same time. Recognizing the potential of reinforcing multiple barriers to entry and planning strategies that involve several competitive advantages will increase the odds for success. In “Determining Competitive Advantages for Tech Firms, Part 2,” I will discuss competitive advantages related to costs and government protection.
Review
This blog post summarizes key competitive advantages for firms, drawing from “Curse of the Mogul.” It emphasizes that success in a market’s structure depends on establishing strong barriers to entry or achieving operational efficiencies, rather than relying solely on brands, deep pockets, talent, global reach, or first-mover status. The post defines market structure and its influencing factors (technology, regulation, network effects, behavior, costs) and focuses on competitive advantages as barriers to entry. It then delves into several categories of competitive advantages.
Economies of scale and network effects are key barriers to entry. Firms can benefit from increased efficiency, including spreading fixed costs over larger production volumes (relevant for digital media with near-zero marginal costs, though AI compute challenges this with their high energy costs). Network effects are the increasing product/service value with more users (direct effects like communication technologies and indirect/cross-network effects seen in platforms like eBay, Uber, Airbnb, and the complementarity of products like Microsoft Office). The post notes that network effects aren’t always sustainable. For example MySpace vs. Facebook showed that network effects can tip one way or another quite fast. Once a platform reaches a critical mass of users, the value it offers becomes hard to replicate.
Customer captivity is reinforced through habitual use crucial for retention, as seen in mobile phone usage. Switching costs also present barriers preventing customers from moving to competitors and include fees, learning effort, equipment costs, and various risks. Also, search costs encourage sticking with an acquired product if the cost of searching start to outweigh the benefits of a new product. Recommendation engines and online reviews can play a role in reducing the costs of searching for a replacement product.
The post concludes by stating that the tech field is still exploring the creation of competitive advantages and barriers to entry. It highlights that multiple competitive advantages can operate simultaneously, increasing the likelihood of success.
Conclusion
This post outlines the critical importance of tech firms establishing powerful competitive advantages, particularly economies of scale, network effects, and customer captivity. These include firms operating in any market, including the dynamic digital media landscape. By dissecting these concepts and providing relevant examples from both traditional and digital companies, it underscores that sustainable success hinges on creating structural barriers to entry or achieving significant operational efficiencies, rather than relying on more superficial advantages often touted by industry leaders. The follow-up post on cost and government protection suggests a comprehensive exploration of the strategic levers available to companies seeking to thrive in competitive markets. Ultimately, the post serves as a framework for understanding how businesses can build lasting advantages in an ever-changing economic environment.
Citation APA (7th Edition)
Pennings, A.J. (2025, May 14). Determining Competitive Advantages for Tech Companies, Part I. apennings.com https://apennings.com/media-strategies/determining-competitive-advantages-for-digital-media-firms-part-1/
Notes
[1] Jonathan A. Knee, Bruce C. Greenwald, and Ava Seave, The Curse of the Mogul: What Wrong with the World’s Leading Media Companies. 2014.
[2] Knee, Greenwald, and Seave argue that the poor financial performance of major media conglomerates isn’t primarily due to external factors like the rise of the Internet. Instead, they contend that it stems from internal operational inefficiencies and misguided strategies driven by the egos and “megalomania” of media moguls. Lack of Focus on Cost Control: The moguls often prioritize growth, acquisitions, and maintaining a powerful image over rigorous cost management. They tend to downplay the importance of “number crunchers” and “pencil pushers,” leading to bloated budgets and unnecessary expenses. Driven by a desire for scale and market dominance, media companies frequently overpay for acquisitions and strategic investments that don’t yield commensurate returns. This misallocation of capital hinders profitability and shareholder value. Even when acquisitions have strategic rationale, poor integration processes often lead to duplicated efforts, loss of synergies, and ultimately, underperformance. The book challenges the notion that simply having the best content guarantees financial success. It argues that efficient distribution, marketing, and monetization strategies are equally, if not more, crucial. Moguls who fixate solely on content creation often neglect these operational aspects. Finally, the authors argued that moguls often believe their creative nature exempts them from standard financial scrutiny. This allows operational inefficiencies to persist without being adequately addressed. Unlike operationally efficient businesses that concentrate on core competencies and streamline processes, media conglomerates often lack focus, dabbling in diverse and sometimes unrelated ventures without achieving deep efficiencies in any one area.
[3]”Reviews: The_Curse_of_The_Mogul.” Quantum Media: Links_Reviews. N.p., n.d. Web. 30 Mar. 2014.
[4] Greenwald, Bruce C. “The Moguls’ New Clothes.” The Atlantic. Atlantic Media Company, 01 Oct. 2009. Web. 30 Mar. 2014.
[5] Jackson, Nicholas. “As MySpace Sells for $35 Million, a History of the Network’s Valuation.” The Atlantic, Atlantic Media Company, 29 June 2011.
[6] I finally found the hard copy of this book at a Borders near Wall Street in New York City.
[7] This post is a rewrite of the version I wrote in 2014. I used Gemini to add a more information on the distinction between network effects and viral marketing.
© ALL RIGHTS RESERVED
Anthony J. Pennings, PhD is a Professor at the Department of Technology and Society, State University of New York, Korea, holding a joint research appointment at Stony Brook University. Before joining SUNY, he taught at St. Edwards University in Austin, Texas. He was on the faculty of New York University. Previously, he and Victoria University in New Zealand. He has also spent time as a Fellow at the East-West Center in Honolulu, Hawaii.
Visual Rhetoric Analysis of Social Media: YouTube Channels and Memes
Posted on | May 1, 2025 | No Comments
What makes a successful YouTube channel? What meaning-making practices are used to make a channel interesting, or informative, or enjoyable? What story is being told, who is telling it, and how is it being told? How are people making money from it? These are some of the main questions we address in the final project of my EST 240 Visual Rhetoric and IT class. It examines the details of imagery or moving images closely for a rhetorical and denotation/connotative analysis of the persuasive techniques and meanings involved.
This post is about using a semiotic or visual rhetoric analysis to understand why some YouTube videos are successful, and others are not. Both rhetoric and semiotics offer valuable, yet distinct, frameworks for analyzing the complexities of visual media. While rhetoric, with its focus on the art of persuasion, examines the strategic use of appeals to ethos, pathos, and logos to influence audiences, semiotics delves into the science of signs, seeking to decode the underlying systems of meaning embedded within visual and auditory elements. Despite their different origins and primary objectives, these two disciplines share a fundamental concern with communication and meaning-making, particularly in our increasingly visually driven world.
The assignment is to interrogate a web channel, looking at its details, from its hosts to its thumbnails, to identify its signifying practices that make it a success. It may not be too different from an assignment to analyze a movie or a novel, as the meaning-making practices are examined much like a media paper. But YouTube is like a film on steroids, or a psychedelic drug. Its commitment to realism is lacking. A lot more is happening, and standard rules of organizing perception are being broken. Analyzing a YouTube channel takes a good eye for identifying details and a strong vocabulary to put what you see into words. It also requires an analytical framework to put the signifying practices into a theoretical perspective that helps create additional understanding of meanings created and the myths supported.
The class starts out with an intensive look at the vocabulary for techniques used in film, television, music videos, and more recently social media tools like Instagram, Rumble, Vine, TikTok. We move on to YouTube channels(with hosts for this assignment). Future versions of this course will also delve into the use of artificial intelligence (AI) to synthesize images and video.
Initially, we work on vocabulary and the “grammar” of visual creation – how moving images are shot and edited/structured to create meaning and narrative. We analyze films, television, music videos, and move on to YouTube videos. Terms like closeup, pan, tilt, parallel editing, and voice-overs provide key conceptual understanding for both technical and analytical purposes. Moving images are shot with a general grammar in mind – establishing shots for creating context, medium shots for introducing subjects and perspective, and closeups for detail and emotion.
I recommend analyzing the channel’s host first, drawing on the analysis of a newscaster or news “anchor.” The anchor secures the narrative of the news story. He or she (or AI it) literally anchors the meaning of the newscast or story. Stuart Hall talks about imagery needing a “fixed” meaning, which I find useful as well. The anchor or host tells a story, fixing the meaning but also moving the story along. What drives the “story” or myth-making? How is the story being told? Narration? Voiceover (VO)? Who is the author? Are they part of the story?
What is the rhetoric of the YouTube channel? What is the purpose of the site? What meanings does it produce? How does it engage the audience? What audience is it producing (How can it be sold to an advertiser?)
Two French terms have guided televisual analysis over the years: Mise-en-scène, for what is in the scene, or the shot. This is a combination of composition, costuming, hair and makeup, lighting, and set design. The other is Montage, from the French “to build,” that refers to the editing process. This action involves the pace of editing, wipes, continuity, and cross-cutting or parallel editing.
Recommended Outline
Introductions are drafted early but the last to be completed. Why is the channel a success? What metrics can we access to measure the success? How many subscribers does it have? How many videos have they produced? How many viewers do they attract? How many comments do they usually get? Can you find out how much money they are making? Dude Perfect has over 60 million subscribers and regularly makes over $20 million a year. It emphasizes male competition and sport. Genre is often an interesting exercise in the process of categorization that determines distinctions as well as similarities. A popular new genre on YouTube is the video blog or “vlog.”
Meaning-Creating Techniques 1 Denotation and Connotation: Host
Meaning-Creating Techniques 2 Denotation and Connotation: Shots (Mise en scène)
Meaning-Creating Techniques 3 Denotation and Connotation: Editing (Montage)
Additional areas of analysis:
Meaning-Creating Techniques 4 Denotation and Connotation: Logo
Meaning-Creating Techniques 5 Denotation and Connotation: Thumbnails
Rhetoric or Semiotics?
Despite their shared interests, rhetoric and semiotics exhibit fundamental differences in their historical development, primary objectives, and the specific analytical tools they employ. Rhetoric has its roots in the classical art of oratory, initially focusing on the principles of effective public speaking and argumentation. Semiotics, on the other hand, emerged later as a broader scientific and philosophical inquiry into the nature of signs and the processes by which meaning is generated and interpreted across all systems of communication, including film and YouTube. Ryan’s World is a particularly rich channel to analyze with almost 40 million subscribers and over 3000 videos.
Rhetoric’s primary concern lies with the persuasive intent behind communication and its impact on the audience’s beliefs or actions. Semiotics, however, has a more encompassing aim to understand the underlying structures and processes of signification, regardless of the communicator’s specific intentions or the message’s persuasive efficacy. Rhetoric traditionally emphasizes the appeals of logos, ethos, and pathos as its core analytical framework for examining persuasive strategies. In contrast, semiotics focuses on dissecting the structure of signs through concepts such as the signifier and signified, and the categorization of signs into icons, indices, and symbols. Furthermore, while rhetoric is primarily centered on human communication, semiotics has a broader scope. It extends its analysis to various phenomena that function as signs, including cultural rituals, fashion systems, and even biological communication among organisms (becoming more relevant with AI and big data’s capacity to capture and decipher animal sounds).
Analyzing Political Memes with Rhetorical Theory
Social media circulates many images with texts called “memes.” These constructions can be both effective and harmful as they can be constructed quickly with modern apps and spread virally through social media. Memes are often anonymous with little or no indication of authorship, yet are often shared from trusted friends.
Rhetoric can be used to analyze the techniques that are used to influence the reader. The ancient Greek philosopher Aristotle identified three fundamental modes of persuasion: ethos, pathos, and logos. These appeals form the cornerstone of rhetorical theory and provide a framework for analyzing how persuasion functions in communication, including visual media and memes.
Ethos is the appeal to credibility and centers on the character and trustworthiness of the communicator. In rhetoric, ethos is established by demonstrating expertise in the subject matter, conveying honesty and goodwill towards the audience, and presenting oneself with appropriate authority and character. For instance, in visual memes, the use of celebrity political endorsements leverages the perceived credibility and admiration associated with the celebrity to build trust in the policy. The audience is more likely to be persuaded by someone they view as knowledgeable, reputable, or possessing good political character. A political meme might showcase a political candidate in professional attire with a party logo.
Pathos is the appeal to emotion and involves persuading the audience by evoking certain feelings. These emotions can range from positive feelings like joy, hope, and excitement to negative ones such as sadness, fear, and anger. Visual media is particularly adept at employing pathos through the use of powerful imagery, evocative slogans, and compelling narratives designed to resonate with the audience’s values, beliefs, and cultural background. For example, a public service announcement might use distressing images to evoke empathy and encourage viewers to take action. A political meme might use patriotic imagery like the national flag to evoke pride.
Logos is the appeal to logic and relies on reason and evidence to persuade the audience. This involves using facts, statistics, logical arguments, and clear reasoning to support a particular claim or viewpoint. In visual rhetoric, logos can be conveyed through the presentation of data in infographics, demonstrations of a policy’s effectiveness, or a logical visual narrative that leads the viewer to a specific conclusion. A clear and specific thesis or claim, supported by well-reasoned arguments, is crucial for a strong appeal to logos. A political meme might include concise policy statements or slogans implying logical benefits.
The effective use of these three appeals, often in combination, is central to the art of rhetoric and its ability to influence audiences with memes quickly. Understanding how ethos, pathos, and logos are employed in visual media provides a valuable framework for analyzing the persuasive strategies at play in our visually saturated world.
Summary
This post underscores that success on YouTube is not just technical or algorithmic but rhetorical and semiotic. Content creators—whether kids unboxing toys or athletes competing—construct complex layers of meaning using visual tools and persuasive strategies. Understanding these tools equips students to critically analyze, produce, or even monetize content more effectively.
What makes a YouTube channel successful? The answer lies in metrics and how content is constructed, delivered, and interpreted. The post encourages a deep investigation of hosts, thumbnails, editing styles, and narrative strategies, using concepts like denotation/connotation, mise-en-scène, and montage — terms borrowed initially from film theory but now applicable to YouTube videos.
Citation APA (7th Edition)
Pennings, A.J. (2025, May 01) Visual Rhetoric Analysis of a YouTube Channel. apennings.com https://apennings.com/technologies-of-meaning/visual-rhetoric-analysis-of-a-youtube-channel/
Notes
[1] Rhetoric has an older lineage and appears to have started with a focus on persuasion and public speaking in ancient Greece. Semiotics, on the other hand, is a more recent and broader field that comes from linguistics and philosophy, looking at all kinds of signs, not just language. While rhetoric often has a goal of influencing people, semiotics is more about understanding how meaning works within different cultures.
© ALL RIGHTS RESERVED
Anthony J. Pennings, PhD is a Professor at the Department of Technology and Society, State University of New York, Korea and Research Professor at Stony Brook University. He teaches AI and broadband policy as well as visual rhetoric. Previously, he was on the faculty of New York University teaching digital economics and media management. He also taught in the Digital Media MBA at St. Edwards University in Austin, Texas, where he lives when not in Korea.
Tags: Chandler > connotation > denotation > Meaning-making practices > Memes > visual grammar > Visual Rhetoric and IT
Digital Disruption in the Film Industry – Part 4: Generative AI for Video Synthesis
Posted on | April 20, 2025 | No Comments
These are still the early days of artificial intelligence (AI) applied to video, but recently, the applications have rapidly accelerated, and enough has happened to comment. OpenAI’s SORA and Google’s Veo-2 are the current vanguards implementing extraordinary innovations in AI video applications but others such as Luma, Pika, and Runway are very competitive. How will these developments disrupt the current paradigm of media production and what does it mean for people wanting to use these new tools?

Generative AI for televisual video synthesis has become a major focus in my class EST 240 – Visual Rhetoric and Information Technologies. Although lectures have mainly focused on the signifying practices used in film, television, and YouTube channels, I am adding portions to cover AI techniques and prompt engineering required for effective AI generated media content. Connecting the vocabulary of televisual production to the possibilities of AI introduces students to new techniques that can enhance their careers.
This post introduces how AI is disrupting the media industry’s capacity to synthesize motion imagery. Generating video with AI requires not only creating visually plausible individual image frames but, crucially, form a coherent sequence with consistent objects, characters, environments, and logical motion over time. AI models achieve this by learning intricate patterns, relationships, and temporal dynamics from analyzing massive datasets containing existing video and image content.
AI can now take text prompts and generate full-motion video, thanks to a new class of computing models called text-to-video generative AI. These models interpret natural language descriptions and produce short video clips with varying levels of realism and coherence. These instruction sets guide the AI’s generation and synthesis of “tokens” – data points that are combined into the visual sequence through various algorithmic processes. Text prompts can be plugged into AI platforms like Runway, Pika Labs, or OpenAI’s Sora. They follow categories like these below.
Visuals: Earth modeled with digital/glowing textures
Focus: North and South America (you can add “seen from the western hemisphere”)
Grid Style: Spreadsheet-like structure wrapping or hovering around the globe
Mood: Futuristic, data-driven, cinematic
Motion: Rotating Earth, flickering grid lines, digital particles
Developing the rhetorical languages that can guide technical detail is important for harnessing the capabilities of generative AI. At a general level we use the French meaning-making concepts of Mise-en-scène and montage from film analysis to develop the understanding and language needed for visual prompts. More on that below after a brief scan of previous work in this series.
The Continuity of Disruption
For decades, AI primarily existed within the realm of science fiction cinema, often depicted as threatening humanity. 2001’s HAL 9000, The Terminator’s Skynet, and the machines of the Matrix series served as cautionary but fantastical tales. Now, AI has transitioned from a narrative trope into a tangible technological force actively reshaping modern moviemaking and continuing the mode of disruption that began with the introduction of microprocessing power in the film and video industries.
In my last post, I discussed the first examples of computer special effects (F/X) in movies such as Westworld (1973) and Star Trek II: The Wrath of Khan (1982) based on NASA’s work with its Jet Propulsion Lab (JPL) to develop an imaging system for Mariner 4, the Mars explorer. Digital F/X has continued with technology such as ILM’s Renderman, one of the first rendering software packages capable of using advanced rendering algorithms and shading techniques to create photorealistic images in CGI. Its allowed filmmakers to achieve lifelike lighting, textures, and reflections, enhancing the realism of digital environments and characters and winning numerous Oscar’s for Best Visual Effects.
AI-powered tools and software have transformed the field of visual effects (VFX) and animation, enabling filmmakers to create stunning, photorealistic CGI sequences and lifelike digital characters. AI algorithms can automate and streamline various aspects of the VFX production process, from rendering and compositing to motion capture and facial animation, saving time and resources while enhancing visual quality.
Before that, I posted on the transformation of post-production practices with the advent of Non-linear Editing (NLE) using AVID and other applications. I was there at the advent of the NLE revolution when the University of Hawaii was the first higher education institution to purchase an AVID NLE. I also used Clayton Christensen’s theory of innovative disruption to describe how digital editing progressed from very basic and almost crude computer applications and technology to the sophisticated, and now often very inexpensive techniques available on devices like smartphones, tablets, and PCs.
I started with how cameras had moved from film to digital, including a discussion on charge-coupled device (CCD) technology developed initially for spy satellites, and the development of cheaper and more energy-efficient complementary metal-oxide semiconductor (CMOS) technology for digital cameras. The 4K resolution achieved by the Red One Camera rocked the film industry in 2007 and the same company’s Red Dragon 6K Sensor in 2013 have been extended into the company’s KOMODO and RAPTOR series.
Although useful in several stages of movie-making and promotion, the process of video synthesis is a cornerstone of its disruptive potential in filmmaking and has been progressing over time. Deepfake technology was the first form of video synthesis that captured the public’s attention when it used AI for face-swapping or recreating actors’ likenesses. Drawing on computer graphics, neural rendering has been used since 2020 in visual effects (VFX) to create realistic textures, lighting, and animations. AI-assisted editing included tools that automated scene cuts, color grading, or suggested improvements. Virtual production is a term that includes AI for real-time rendering, facial tracking, and scene generation. Synthetic media involves AI-generated visuals, dialogue, or characters for digital doubles or de-aged actors in movies such as Martin Scorsese’s The Irishman (2019) as seen here.
Generative AI and Prompt Engineering for Video Synthesis
Generative AI such as Sora and New York City’s Runway is primarily focused on creating models and products for generating videos, images, and various multimedia content. AI is not a single, monolithic entity but rather a collection of rapidly changing technologies – including machine learning, natural language processing (NLP), computer vision, and sophisticated generative models – that are impacting nearly every facet of how films are conceived, created, and consumed. AI using machine learning algorithms and natural language processing, have been used to generate and analyze scripts, develop story ideas, and create entirely new digital content.
AI-driven systems also analyze vast amounts of data, including audience preferences, trends, and historical box office performance, to inform content creation decisions and even predict potential commercial success. The pace of change has accelerated dramatically in recent years, propelled by breakthroughs in generative AI, particularly diffusion models capable of creating increasingly realistic images and video sequences. These tools are increasingly available for use if you know how to access and guide them.
Notice the guidelines in this information about prompts from a dedicated YouTube channel.

Several platforms have emerged as leaders in the text-to-video and image-to-video generation space. Google’s Imagen Video and Veo, Meta’s Make-A-Video, Pika, Runway’s Gen-3, and Stable’s Diffusion Video currently have some of the most innovative models. These platforms introduce entirely new techniques for audiovisual content creation. This includes generating synthetic actors or digital doubles; creating photorealistic VFX elements like environments or specific effects such as explosions and intense weather; synthesizing video directly from text or images; generating dialogue or sound effects; and performing digital de-aging or applying digital makeup.
The process is pretty straightforward. At one level it follows the basic Turing computer model of input, processing, and output. You give a prompt like: “A dynamic 3D spreadsheet grid forms in space, encapsulating a glowing digital Earth. The Earth rotates slowly, with North and South America prominently displayed. The grid pulses with data streams and numbers, representing global analytics. Cinematic lighting with a futuristic blue and green palette, viewed from a slow-moving orbital camera.” Another level kicks in and AI processes the request using a multimodal transformer model trained on text and video data to interpret the scene from the text prompt. Then it outputs a short video (typically 2–20 seconds) showing that scene with motion, lighting, and camera movement.
Engines of Visual Generation
Conceptually, generative AI models are a class of AI systems specifically designed to create new, original data (text, images, audio, video, 3D models, etc.) that mimics the patterns and characteristics learned from their training data. Large Language Models (LLMs) like Chat GPT are particularly useful for researching and generating text that answer basic queries and research questions. Unlike discriminative models that classify or predict based on input, generative models learn the underlying distribution of the data to synthesize novel outputs. The process typically involves encoding the text prompt into a meaningful representation, (often using models like CLIP, a neural network that efficiently learns visual concepts from natural language supervision) which then conditions or guides the generative model (usually a diffusion model) during the video synthesis process.
Several core machine learning architectures and engines of visual generation underpin modern AI video generation. Key architectures enabling this include Generative Adversarial Networks (GANs), Diffusion Models, Variational Autoencoders (VAEs), as well as Transformers & RNNs (LSTMs). Each have specific strengths and weaknesses in generating different types of media.
GANs consist of two neural networks — a generator that creates synthetic data (images/video frames) and a discriminator that tries to distinguish between real and synthetic data. Through this adversarial process, the generator learns to produce increasingly realistic outputs. GANs are known for generating sharp, detailed images and can be relatively fast at generation once trained. However, they can be notoriously difficult to train stably and may suffer from “mode collapse,” where the generator produces only a limited variety of outputs. While used in some video synthesis approaches, they have been largely superseded by diffusion models for state-of-the-art results.
Diffusion models are a class of models has become dominant in high-quality image and video generation. The process involves two stages: first, gradually adding noise to training data over many steps until it becomes pure noise. Then, it trains a model (typically a U-Net architecture) to reverse this process, starting from noise and iteratively removing it (denoising) to generate a clean sample. Diffusion models generally produce higher-quality and more diverse outputs than GANs, often achieving superior realism. They also offer more stable training. A main drawback is the significantly slower generation speed due to the iterative denoising process, which can be thousands of times slower than GANs. Latent Diffusion Models (LDMs) address this partially by performing the diffusion process in a lower-dimensional “latent space” created by an encoder (like a VAE), making it more computationally efficient.
The Variational Autoencoders (VAEs) are generative models that have been repurposed for generative AI. They learn to encode data into a compressed latent representation and then decode it back. While they can generate images, these might sometimes be blurrier than GAN outputs. Their primary role in modern video synthesis is often as the encoder and decoder components within Latent Diffusion Models, enabling efficient processing in the latent space. They have also been explored for predicting motion in video generation and are used in generating image aspects.
Transformers and RNNs (LSTMs) include architectures that excel at processing sequential data. Transformers, particularly models like CLIP (Contrastive Language-Image Pretraining), are crucial for understanding the relationship between text prompts and visual content, enabling effective text-to-image and text-to-video generation by guiding the diffusion process. Vision Transformer (ViT) blocks are often integrated within the U-Net architecture of diffusion models. Recurrent Neural Networks (RNNs), such as LSTMs, have been used in earlier or alternative video generation models to help maintain temporal consistency across frames.
Temporal Consistency
The challenge of coherent motion is achieving temporal consistency – ensuring that objects, characters, lighting, and motion remain coherent and believable from one frame to the next throughout the video sequence. Without this, videos can appear jittery, nonsensical, or suffer from flickering artifacts. Diffusion models employ several techniques to address this critical hurdle for AI video generation. One is 3D U-Nets, architectures that extend the standard 2D U-Net used in image diffusion by incorporating a temporal dimension. Convolutions and attention mechanisms are factorized to operate across both space (within a frame) and time (across frames).
Another technique are temporal attention layers. These are specific layers added to the network architecture that allow different parts of a frame to “attend to” or share information with corresponding parts in other frames, explicitly modeling temporal relationships. Different attention strategies exist, such as attending to the same spatial location across all frames (temporal attention) or attending only to past frames (causal attention).
Frame interpolation is a video processing technique that creates new intermediating image frames between existing ones. It seeks to improve video quality by increasing the frame rate. Frame interpolation can be achieved through motion estimation that produces intermediate frames by calculating the motion vectors of pixels or blocks of pixels between frames and using them to predict the newly created frame. These vectors track the movement of pixels or blocks of pixels from one frame to the next and an algorithm predicts how objects in the video should move between the frames. By using these motion vectors, the algorithm can predict and generate new frames that follow the estimated motion paths.
A simpler approach blends the existing frames to create a new frame, although this can produce blurring or ghost effects. Also, morphing shapes objects from one frame to another and can be computationally intensive.
A related technique is hierarchical upsampling that uses text-to-video synthesis and operates like building a movie from a storyboard to provide high-resolution and temporally coherent video. It’s a core design principle in advanced generative models like Sora, Runway Gen-2, and Pika to scale from idea to realistic video. It starts with a sparse set of keyframes first and then uses the model (or simpler interpolation) to generate new and intermediating frames. It is easier to generate low-res previews and refines details. This progressively adds more frames per second to refine the spatial resolution while capturing the core semantics of the scene: motion, structure, general composition. Noise prediction and diffusion models are applied to enhance detail. These upsampling stages refine the spatial resolution and temporal consistency before investing in full computation for the final high-resolution (720p or 1080p at 24–30 fps) output with fine textures, lighting, shadows, and subtle motion.
Newer models like Sora aim to build more sophisticated internal representations of the world, including basic physics and object permanence, to generate more consistent and plausible motion and interactions. Despite progress, challenges remain. Maintaining high quality and consistency often becomes harder as the desired video length increases. Fine details, such as text legibility or the accurate depiction of complex objects like hands, can still be problematic, resulting in garbled or distorted outputs.
The quest for robust temporal consistency represents the next major frontier in AI video generation. While image generation models now produce stunningly realistic static visuals, the true utility of AI video in professional filmmaking hinges on its ability to create not just beautiful frames, but coherent, believable sequences. The techniques being developed—temporal attention, 3D architectures, world models—are direct responses to this fundamental challenge.
The qualitative difference between various AI video models often lies precisely in their capacity to handle motion, object persistence, and logical progression over time. Consequently, advancements in ensuring temporal coherence will be the primary driver determining how quickly and effectively AI video transitions from generating short, experimental clips to becoming a practical tool for longer-form narrative filmmaking. Overcoming current limitations, such as the occasional physics glitches or inconsistencies observed even in advanced models, is paramount. This area is where significant research, development, and competitive differentiation among AI platforms will likely occur in the near future.
That’s a Wrap!
As a continuation of my focus on disruption in the film industry, this post discusses the rapid advancements in AI-generated video and its growing impact on the media industry, particularly filmmaking. Generative AI models like Sora and Google Veo-2 are making significant strides in creating realistic and coherent video from user-initated text prompts. The post emphasizes the importance of teaching “prompt engineering” (crafting effective text instructions for AI) in media production courses, connecting it to traditional filmmaking concepts like mise-en-scène and montage.
A major hurdle in AI video generation is achieving temporal consistency, which means ensuring that objects, characters, and motion remain believable and coherent across video frames. It explains the workings of key AI architectures used in video synthesis, including GANs, Diffusion Models, VAEs, and Transformers. It highlights the dominance of Diffusion Models in achieving high-quality results. The post details specific techniques used to address the challenge of creating coherent motion, such as 3D U-Nets, temporal attention layers, frame interpolation, and hierarchical upsampling. The next major frontier in AI video generation is improving temporal consistency and overcoming limitations like inconsistencies and artifacts, especially in longer-form video.
In the meantime, many people can prepare for the opportunities inherent in AI-generated video production by developing their understanding and vocabulary of televisual production that they will need for effective prompting of desired moving image content.
Citation APA (7th Edition)
Pennings, A.J. (2025, Apr 20). Digital Disruption in the Film Industry – Part 4: Generative AI for Video Synthesis. apennings.com https://apennings.com/ditigal_destruction/digital-disruption-in-the-film-industry-part-4-generative-ai-for-video-synthesis/
© ALL RIGHTS RESERVED
Anthony J. Pennings, PhD is a Professor at the Department of Technology, (AI), and Society, State University of New York, Korea teaching visual rhetoric and AI and broadband policy and holds a joint appointment as a Research Professor at Stony Brook Univeristy. From 2002-2012 he was on the faculty of New York University where he taught digital economics and media management. He also taught in the Digital Media MBA at St. Edwards University in Austin, Texas, where he lives when not in Korea.
Tags: Diffusion Models > Generative Adversarial Networks (GANs) > generative AI > prompt engineering > text-to-video > Variational Autoencoders (VAEs)
Moving Economic and Financial Curves
Posted on | March 9, 2025 | No Comments
I’ve previously written about how the historical development of “one price” and equillibrium changed political economy to economics due to the development of market graphs. In these visualizations that empowered a new economics, supply and demand curves intersect at a “market clearing” price where suppliers and buyers of a good or service are happy to enact the transaction. This post lays out market logic and discusses what happens when changes in prices occurs, and when other factors might influence suppy and demand. The second part looks more closely at how supply and demand are both important and different in financial markets.
In financial markets, for example, the law of one price essentially states that identical or equivalent financial assets should trade at the same price, regardless of where they are traded. This is driven by the idea that if a discrepancy exists, arbitrageurs will exploit it, buying the asset where it’s cheaper and selling it where it’s more expensive, thus driving the price toward equality. If a company’s stock is traded on multiple exchanges, the law of one price suggests that its price should be the same across those exchanges (accounting for currency exchange rates, if applicable).
The equilibrium price is not static. It constantly adjusts based on shifts in supply and demand. If demand increases, the equilibrium price will likely rise, and vice versa. This post looks at factors that increase or decrease economic and financial curves.
Alfred Marshall, pictured below, made a valuable contribution to our understanding of supply and demand with his visible representation of the equillibrium price. Consequently, this framework provides a valuable graphical and mathematical foundation for understanding economic and financial market dynamics.
There are basic causes of a price change to be noted – shifts in demand (increase or decrease), supply (increase or decrease), or both

Although it’s important to distinguish between a “movement along” the demand curve (caused by a change in price), “shifts” of the demand curve can be caused by many other factors.
- Demand shifts to the right – An increase in demand shifts the demand curve to the right. This raises the price and output.
- Demand shifts to the left – A decrease in demand shifts the demand curve to the left. This reduces price and output.
- Supply shifts to the right – An increase in supply shifts the supply curve to the right. This reduces price and increases output.
- Supply shifts to the left – A decrease in supply shifts the supply curve to the left. This raises price but reduces output.
Factors That Shift the Demand Curve
– Income
For normal goods, an increase in income leads to an increase in demand (a rightward shift). For normal goods, a decrease in income leads to a decrease in demand (a leftward shift). For inferior goods (like generic brands), an increase in income leads to a decrease in demand, and vice versa.
– Prices of Related Goods
If the price of a substitute good increases, the demand for the original good increases (a rightward shift). If the price of a complementary good increases, the demand for the original good decreases (a leftward shift).
– Tastes and Preferences
Changes in consumer tastes and preferences, often influenced by advertising, trends, or cultural shifts, can significantly impact demand. Increased preference leads to increased demand (a rightward shift). Decreased preference leads to decreased demand (a leftward shift).
– Expectations
Consumer expectations about future prices, income, or availability can influence current demand. If consumers expect prices to rise in the future, current demand increases (a rightward shift). If consumers expect prices to fall in the future, current demand decreases (a leftward shift).
– Number of Buyers
An increase in the number of buyers in a market increases overall demand (a rightward shift). A decrease in the number of buyers decreases overall demand (a leftward shift).
– Demographic Changes
Changes in the size and composition of the population. For example a increase in the elderly population increases the demand for healthcare.
Accordingly, any factor that changes consumers’ willingness or ability to purchase a good or service at a given price will cause the demand curve to shift.
In market graphs, the supply curve illustrates the relationship between the price of a good or service and the quantity that producers are willing to supply. Once again, it’s important to differentiate between a “movement along” the supply curve (caused by a change in price) and a “shift” of the supply curve (caused by other factors).
Factors That Shift the Supply Curve
– Costs of Production
Changes in the prices of inputs, such as labor, raw materials, and energy, directly affect the cost of production. Increased costs shift the supply curve to the left (a decrease in supply). Decreased costs shift the supply curve to the right (an increase in supply).
– Technology
Technological advancements can improve production efficiency, reducing costs and increasing output. New technology generally shifts the supply curve to the right.
– Government Policies
Taxes on production increase costs, shifting the supply curve to the left. Subsidies reduce production costs, shifting the supply curve to the right. Regulations can increase or decrease production costs, depending on their nature, and therefore shift the supply curve accordingly.
– Number of Sellers
An increase in the number of sellers in a market increases the overall supply, shifting the curve to the right.
A decrease in the number of sellers decreases supply, shifting the curve to the left.
– Expectations of Future Prices
If producers expect prices to rise in the future, they may reduce current supply to sell more later, shifting the curve to the left.
If they expect prices to fall, they may increase current supply, shifting the curve to the right.
– Prices of Related Goods
If the price of a related good that producers could also produce increases, they may shift production towards that good, decreasing the supply of the original good (shifting the supply curve to the left).
– Natural Disasters
Natural disasters can heavily effect the amount of goods that can be produced. Therefore these events can cause massive shifts in the supply curve.
Basically, any factor that changes the producers’ ability or willingness to supply a good or service at a given price will cause the supply curve to shift.
What Factors Change Demand and Supply Curves in Financial Markets?
In financial markets, like any other market, the interplay of supply and demand determines prices. However, the factors that shift these curves have some unique characteristics.
Factors Affecting Demand in Financial Markets
– Interest Rates
When interest rates fall, borrowing becomes cheaper, increasing the demand for loans and other debt instruments. Conversely, higher interest rates reduce borrowing and can increase the demand for interest-bearing assets like bonds.
– Investor Sentiment
Optimism about the economy or a particular asset can increase demand. Fear and uncertainty can lead to a decrease in demand, as investors seek safer havens.
– Economic Data
Strong economic indicators, like GDP growth or low unemployment, can increase demand for stocks and other risk assets. Weak economic data can have the opposite effect.
– Inflation Expectations
Rising inflation expectations can decrease demand for bonds, as their real return erodes.
Conversely, it can increase demand for assets that are expected to outpace inflation, like commodities or certain stocks.
– Government Policies
Fiscal policies, like tax cuts or increased government spending, can stimulate demand. Monetary policies, like changes in the money supply, can also influence demand.
– Changes in Risk Aversion
When investors risk aversion is low, they are more willing to purchase riskier assets, increasing demand. When risk aversion is high, demand shifts to safer assets.
Factors Affecting Supply in Financial Markets
– Central Bank Policies
Central banks influence the supply of money through open market operations, reserve requirements, and the discount rate. These actions directly impact the supply of credit and other financial instruments.
– Corporate Issuances
Companies issue stocks and bonds to raise capital, increasing the supply of these instruments.
The number of corporate issuances depends on factors like economic conditions and interest rates.
– Government Issuances
Governments issue bonds to finance their spending, adding to the supply of debt instruments.
– Investor Expectations
If investors expect the price of an asset to fall, they may increase their supply of that asset in order to sell before the price drops.
– Profitability Expectations
If a company is expecting high profitability, they may issue more stock, increasing supply.
Key Differences from Traditional Goods Markets
In reality, frictions in financial markets like transaction costs, taxes, and information asymmetries can prevent the law of one price from holding perfectly. Also, the degree to which the law of one price holds depends on the efficiency of the market. In highly efficient markets, price discrepancies are quickly eliminated. Lastly, some financial instruments are highly complex, making it difficult to determine whether they are truly identical.
In financial markets, expectations play a much larger role than in markets for physical goods. Information flows very rapidly, leading to quick adjustments in supply and demand. Psychological factors, like fear and greed, also have a significant impact on market dynamics.
Citation APA (7th Edition)
Pennings, A.J. (2025, March 10) Moving Economic and Financial Curves. apennings.com https://apennings.com/dystopian-economies/moving-the-curves-to-achieve-equillbrium-prices/
© ALL RIGHTS RESERVED
Anthony J. Pennings, PhD is a professor at the Department of Technology and Society, State University of New York, Korea and holds a joint position as a Research Professor for Stony Brook University. He teaches policy and ICT for sustainable development. From 2002-2012 he taught digital economics and information systems management at New York University. He also taught in the Digital Media MBA at St. Edwards University in Austin, Texas, where he lives when not in the Republic of Korea.
Markets and Prices: Pros, Cons
Posted on | February 23, 2025 | No Comments
Economists argue that using a money system with flexible prices is the best way to ration scarce goods and services in a society. They point to alternative approaches – lotteries, political or physical force, random assignment, and queues/lines – as seriously flawed distribution strategies. The specter of people in Communist countries lining up for their commodities provided compelling images and narratives supporting the price mechanism and the social dynamic that many people call “markets.” This post examines how markets emerged and what is valuable and detrimental about them. It discusses the underlying economic understanding of markets and includes several critiques of this term and our allegiance to them.
The term “market” evokes imagery of a medieval city center or town square filled with merchants peddling food or wares and haggling over prices with interested visitors and potential customers. It has achieved considerable circulation as the dominant metaphor for understanding the modern “free enterprise” economy.
For economists, markets refer to arrangements, institutions, or mechanisms facilitating the contact between potential sellers and buyers. In other words, a market is any system that brings together the suppliers of goods or services with potential customers and ideally helps them negotiate and settle the terms of a transaction, such as the currency and the price. But what are the downsides to our reliance on markets?
If you spell market backward, you get “tekram,” an interesting, if hokey, reminder that markets are social technologies and need to be created and managed. RAM or random-access memory is a computer term that signifies how much memory or “working space” you have available on your device. The more RAM, the more applications you can keep running simultaneously without losing significant speed. Likewise, markets need environments accommodating many participants and providing safe, swift, and confidential transaction capabilities without downtime or other technical problems. The more buyers and sellers, the better a market can work. Economists have begun recognizing that digital markets require attention to several conditions, including privacy, interoperability, and safety, to facilitate transactions and make a digital economy work effectively.
Characteristics of Markets
Economists have identified specific characteristics of the market phenomenon. For one, a market depends on the conditions of voluntary exchange where buyers and sellers are free to accept or reject the terms offered by the other. Voluntary exchange assumes that trading between persons makes both parties to the trade subjectively better off than before the trade. Markets also assume that competition exists between sellers and buyers and that the market has enough participation by both to limit the influence of any one actor.
Effective economic models of markets are based on the idea of perfect competition, where no one seller or buyer can control the price of an “economic good.” In this vision of a somewhat Utopian economic system, the acts of individuals working in their self-interest will operate collectively to produce a self-correcting system. Prices move to an “equilibrium point” where producers of a good or service will be incentivized or motivated to supply an adequate amount to meet the demand of consumers willing to pay that price. Unless someone feels cheated, both parties end the transaction satisfied because the exchange has gained them some advantage or benefit.
Central to any market is a mutually acceptable means of payment. A crucial condition is the “effective demand” of consumers – do the buyers of economic goods have sufficient currency to make the purchase? Consumers must desire a good, plus the money to back it up. While parties may exchange goods and services by barter, most markets rely on sellers offering their goods or services (including labor) in exchange for currency from buyers. The system depends on a process of determining prices.
A media perspective on economics starts with media, which includes money and other symbolic representations that influence economic processes. Markets only function well with the efficient flow of information about prices, quantities, and the availability of goods and services. Buyers need to know what’s available and at what cost, while sellers need to understand what consumers are willing to pay. Information systems and media help reduce information asymmetry, where one party has more information than the other, which can lead to unfair or inefficient outcomes.
Media, in various forms, play a crucial role in disseminating this information. Traditionally, this involved newspapers, trade publications, and physical marketplaces. Today, digital media like websites, e-commerce platforms, and social media play a dominant role in conveying price information and connecting buyers and sellers. Consumers can compare prices, research products, and read reviews, while producers can track market trends, analyze competitor behavior, and adjust their strategies accordingly. Information systems and media then facilitate interaction by providing platforms for communication, negotiation, and transaction processing.
The Price System
How do prices decrease or increase? The quick answer is that companies adjust their price sheets. However, some companies have more pricing power than others, so let’s go through the economic arguments and explanations about prices.
Central to the process of economic exchange is the determining of prices. A price is commonly known as the cost to acquire something, although it is important to keep some distance between the words “price” and “cost.” Both have specific accounting meanings. In accounting, cost represents the internal investment made by a business to produce or acquire something, while price represents the external value exchanged with customers in the marketplace. Price is the money (or other currency) a customer or buyer pays to acquire a good, service, or asset.
Prices are the value exchanged to benefit from the good or service. Prices can be figured in monetary terms, but other factors like time, effort, or even foregoing other opportunities are often considered. Businesses need to set prices that cover their costs and generate a profit while remaining competitive in the market.
Buyers determine what value they will get from the purchase. While prices are ultimately a factor in the one-on-one relationship between a buyer and a seller, prices are determined within a social context.
Besides helping to reconcile the transaction between a buyer and a seller, a system of prices helps signal what is scarce and what is abundant. It helps gauge the demand for something and the incentives for producers to supply it. A price system allocates resources in a society based on these numerical monetary assignments and is, hopefully, determined by supply and demand.

Prices are influenced by society’s communication systems. They are negotiated within the confines of languages, modes of interaction, and the ability to be displayed by signage and posted on various media. Reuters created the first online market for global currencies in the 1970s by linking up computer terminals in banks worldwide. It was a time shortly after the US dollar went off the gold standard and global currencies were in flux.

They charged them to list their prices for various national monies and again for subscribing to the system. It was the early 1970s, so the numbers and letters were listed in old-style ASCII computer characters, and traders concluded deals over the phone or through teletype. However, having the prices of each currency listed by each participating bank created a virtual market. By the 1980s, digital technology was dramatically transforming the globe’s financial system, trading trillions of dollars daily in currencies and other financial instruments.

Amazon has a dynamic pricing system that changes the rates on thousands of products during a single day. Sellers can change the price of their goods through Amazon Seller Central or participate in a dynamic repricing system like xSellco or RepriceIT that automatically undercuts competitor prices. A seller can ensure that the amount will not incur a loss by setting a minimum price. If you’re a seller on Amazon.com, a critical factor for your online success is keeping your inventory priced right so it doesn’t stagnate or lose money. Innovations like Honey and Piggy provide free browser extensions that find better prices on Amazon and other e-commerce sites and apply coupons at checkout.
Economists consider allocating a society’s goods and services by price setting to be the most efficient system of rationing—the role of rationing increases when evaluations of scarcity emerge. The rationing process can be either price or non-price-based. However, the latter approaches, including lotteries, queues, coupons, force, or even sharing, impose additional costs such as waiting times and may result in black markets. The price system tends to be responsive but, as will be mentioned later, imposes other social costs.
Equilibrium and the Turn from Political Economy
In economic theory, a working and efficient market is based on prices converging. All the same items must have only one price. Otherwise, buyers will to continue to search for a better price or opportunities for arbitrage arise. In other words, items could be easily be purchased from the merchant offering the lower price or the product will be bought by middlemen and sold to another seller.
William Stanley Jevons, a Professor of Political Economy at University College London came up with the Law of One Price in the mid-19th century, but it goes more often by its contemporary formulation, the “equilibrium price” or the market-clearing price. When a good or service reaches such a price it will be attractive to for buyers to buy, and sellers to sell. Ideally, the market will clear, i.e., all customers will get the amounts of the product they are satisfied with and all items will be sold as the suppliers will be satisfied with the price as well.[1]
In Jevons’ Theory of Political Economy contributions, he helped separate modern “neoclassical” economics from political economy. With the one price formulation, mathematics replaced history as the central vehicle for constructing theories about economics by providing an internally coherent system for producing models of market processes and a logic for predicting human economic behaviors.
The reader should search the Internet for images of supply and demand charts while reading this section.
With the one price theory came a new emphasis on the supply-demand framework and graphs that allowed prices to be plotted and optimized. These graphs use supply and demand curves that describe the relationship between the quantity of goods or services supplied and demanded. They describe not just the equilibrium price but suggest how much of a good or service would be sold at various prices.
Alfred Marshall wrote the Principles of Economics (1890) and explained how the supply-and-demand logic could be graphed. He described supply and demand curves and how they connected to various prices, including the market equilibrium price. An increase in the price of a good is associated with a fall in the quantity demanded of that good and an increase in the amount that will be supplied by producers. As a product gets more expensive, less of it sells.[2]
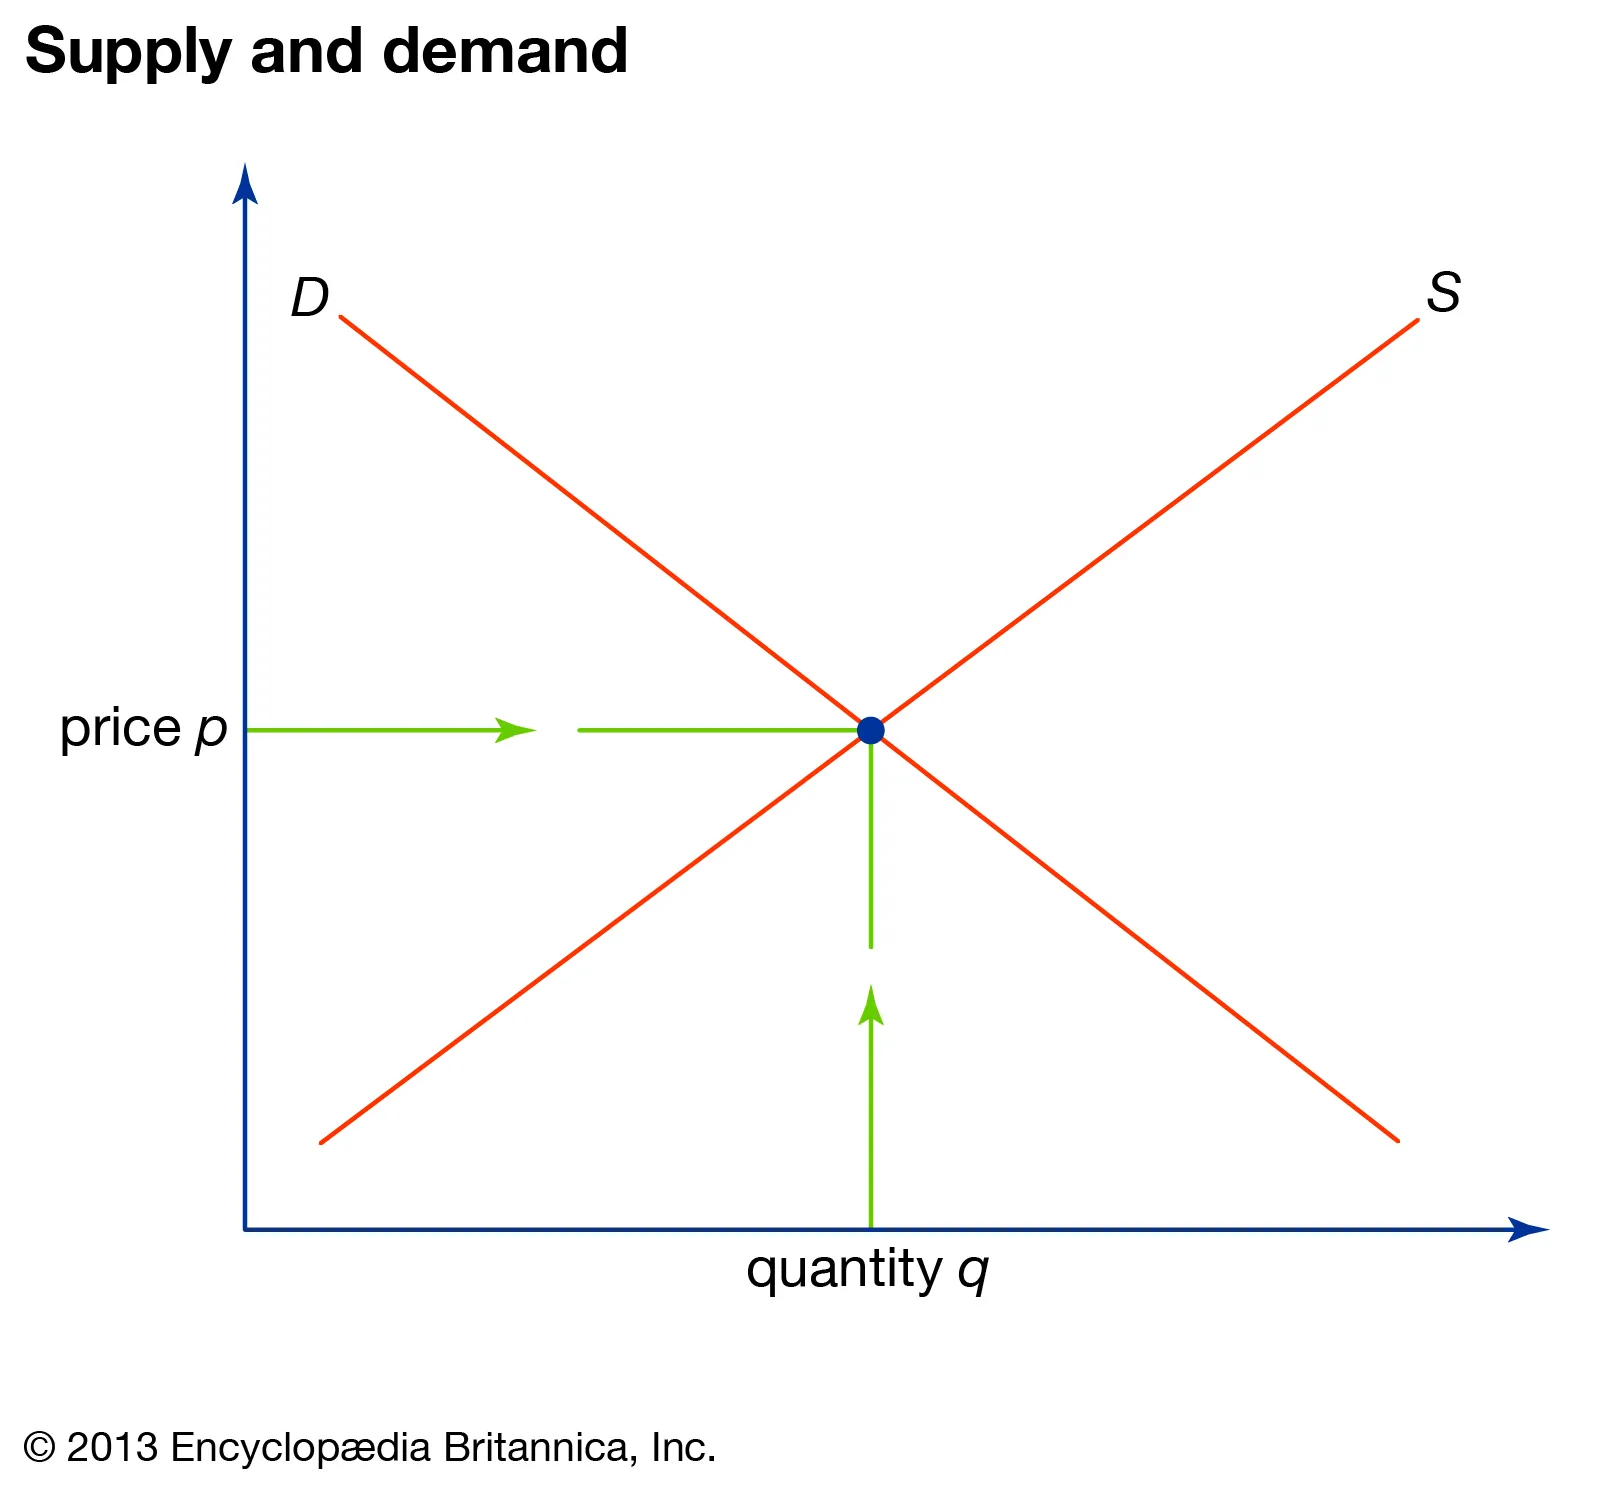
Conversely, a decline in the price of a good is associated with an increase in the quantity demanded of that good and in a decline in the number supplied by producers. This last point is important, the lower the price of the good, the less incentive to produce it. These dynamics result in the representation of a law of supply depicted by an upward-sloping curve while the law of demand is presented by a downward-sloping curve. The equilibrium price can be found at the point where the two curves intersect. This is the magical “clearing point” where all goods are sold. Price discovery is a common term in economics and finance to describe the process of determining the price of an asset by the interaction of buyers and sellers. It is a key function of a marketplace, even digital markets. When the “one price” is discovered, it leads to a clearing of the market.
An important concept in understanding prices is a product’s degree of elasticity. This refers to the influence of price changes on the quantities of product that are desired by consumers. Will a significant change in the price of buying a movie ticket influence audience attendance at theaters? And by how much? Will the launch of a new Apple iPhone that comes with a substantial price increase result in decreased sales, or will factors such as brand loyalty or customer captivity diminish the influence of the price increase? Understanding the elasticity of a product’s prices will tell us something about the sensitivity of that product’s market to changes in the price. A business can risk charging higher prices if the demand for the product’s price is inelastic. If it is elastic, a change in price is likely to result in major changes in consumption.
The pros and cons of markets are hotly debated today. Some believe markets are an ideal system to organize society. Proponents often cite Adam Smith’s famous “invisible hand” as the God-given mechanism that organizes a harmonious society based on market activity. But Smith only used the term once, at the end of The Wealth of Nations (1776) and was more focused on the production of economic activity by working people.
Others believe markets are prone to failure and give rise to unequal conditions and challenge democratic participation. It is no surprise that Karl Marx was a voracious reader of Adam Smith and his theories that the population was the source of economic wealth. Marx just didn’t think the people who did the work got a fair deal in the process of economic production. Marx believed that the conditions of capitalist markets meant that the wealth of economic activity went mainly to the owners of “the means of production” through profits. And the people doing the work were forced to compete against each other in the labor market, driving wages down. The following section looks at other concerns about markets from conteporary economists.
Evaluating the Market System: Pros and Cons
One of the best explanations of the strengths and weaknesses of the market system came from The Business of Media: Corporate Media and the Public Interest (2006) by David Croteau and William Hoynes. They pointed to the strengths of markets, such as efficiency, responsiveness, flexibility, and innovation. They also discuss the limitations of markets as well. These include enhancing inequality, amorality, failure to meet social needs, and the failure to meet democratic needs.[3]
The market provides efficiency by forcing suppliers to compete with each other and into a relationship with consumers that requires their utmost attention. The suppliers of goods and services compete with one another to provide the best products, and the competition among them forces them to bring down prices and improve quality. Firms become organized around cutting costs and finding advantages over other companies. They have immediate incentives to produce efficiencies as sales and revenue numbers from market activities provide an important feedback mechanism.
Responsiveness is another feature of markets that draws on the dynamics of supply and demand. Companies strive to adapt to challenges in the marketplace. New technologies and expectations, changes in incomes as well as tastes and preferences of consumers require companies to make alterations in their products, delivery methods, and retail schedules.
Likewise, consumers respond to new conditions in their ability to shop for bargains, find substitute goods, and adopt to new trends. Going online has meant new options for discovering, researching, and purchasing products. Combined with logistical innovations by companies like FedEx and TNT, ecommerce has shifted the consumption dynamic making it easier for customers to search for products, read the experiences of other consumers for that product, and have it delivered right to their homes.
Flexibility refers to the ability of companies to adapt to changing conditions. In the absence of a larger regulatory regime, companies can manufacture new products, new versions of products, or move in entirely new directions. In a market environment, companies can compete for consumers by making changes within their organizational structure, including adjustments in production, marketing, and finance.
Lastly, markets stimulate innovation in that they provide rewards for new ideas and products. The potential for rewards, and necessities of gaining competitive advantages, drive companies to innovate. Rewards can include market share, but also increased profits. Without competition, firms tend to avoid risk, an essential component of the innovation calculus, as many experiments fail.
Croteau and Hoynes and others point out serious concerns about markets that economists do not generally address. The tendency of markets to reproduce inequality is one important drawback to markets. While some inequality produces contrast and incentives to work hard or to be entrepreneurial, a society with a major divide between haves and have-nots will tend towards decreasing opportunities and incentives to work and innovate. Places with major divisions in wealth tend to be dystopic, a “sick” place. Sir Thomas More’s classic Utopia (1506) told of a mythical island where money was outlawed. Having gold was ridiculed and used for urinals and chains for slaves. It was a mythical place meant to be a social critique of inequalities of England. It denounced private property and advocated a type of socialism.
Thomas Piketty’s Capital (2015) addressed this issue of inequality head-on and warns that investment money gravitates towards more inequality. He targeted the trickle-down effects of capitalism and its tendency to lead to a slower and slower drip of money to those in the lower rungs. Neo-elites benefiting from the rolling back of the estate tax have advantages that others don’t have while often contributing less to the economy. We now have a generation inheriting money from their parents’ windfalls during the digital revolution.
“One dollar, one vote” is a common metaphor and an area of research to refer to the advantages the rich have over the poor. As they have many more dollars, the rich have many more votes to influence the political economy. Countries with a greater concentration of wealth at the upper incomes tend to have less progressive tax and welfare policies while countries with a richer poor tend to have a more government support for poorer people.
The second concern they have about markets is that they are amoral. Not necessarily immoral, but rather that the market system only registers purchases and prices and doesn’t make moral distinctions between, for example, human trafficking, drug trafficking, and oil trafficking. The commerce in a drug to cure malaria does not register differently from a recreational drug that provides a temporary physical stimulation (Illegal drugs are not registered in GDP). Markets do not judge products unless it registers changes in demand. It does not favor child care, healthy foods, or fuel-efficient cars, unless customers make their claims in currency via increased demand.
Can markets meet social needs? A number of services and sometimes goods should probably be provided by some level of government – defense, education, family care and planning, fire protection, food safety, law enforcement, traffic management, roads and parks. More complicated are issues related to electricity and telecommunications. A pressing question for the last thirty years has been the increasing privatization of activities that governments had actively engaged in. The telecommunications system for example, was considered a natural monopoly at first in order to protect its mission to provide universal telephone service, usually through government agencies called PTTs (Post, Telephone, and Telegraph) or through heavily regulated monopolies like AT&T in the US. Through the 1980s and 1990s, these entities were deregulated, opened to competition, and sold off to private investors. This allowed a global transformation to Internet Protocols (IP), but has challenged longstanding commercial traditions such as net neutrality and common carriage that restricts telecommunications and transportation organizations from discriminating against any customer.
Can markets meet democratic needs? Aldous Huxley warned of becoming a society with too many distractions, too much trivia, seeped in drugged numbness and pleasures. Because markets are amoral, they can become saturated with economic goods that service vices rather than public spirit. Competition, in this case, may result in a race to the lowest common denominator (sugar foods) rather than higher social ideals. Rather than political dialogue that would enhance democratic participation, the competition among media businesses tends to drive content towards sensationalist entertainment. This includes social media that allows participants to share information from a variety of news sources that are biased, one-sided, and often distorted.
Comedian Robin Williams once quipped, “Cocaine is God’s way of telling you that you are making too much money.” Markets provide powerful coordination systems for material production and creative engagement, but they also generate inequalities, often with products and services that are of dubious social value. How a society enhances and/or tempers market forces continues to be a major challenge for countries around the world.
For a market to function effectively, it needs several dynamics to succeed. One of the most important factors for a market to prosper is a successful currency. A medium of exchange will depend on trust in the monetary mechanism as buyers and sellers must readily accept and part with it. Money has had a long history of being things, most notably gold. Gold has striking physical attributes: it doesn’t rust, it doesn’t chip, and it can be melted into a variety of shapes. Other metals such as silver and platinum have also served as money. Credit cards, third party payment systems such as Paypal, and new digital wallets like Apple Pay and Samsung Pay provide new conveniences that facilitate economic transactions.
It is interesting that societies gravitate towards the use of some symbolic entity to facilitate these transactions. As discussed in the previous chapter, money can be anything that a buyer and seller agree is money. At times, commodities such as rice or tobacco and even alcohol have served the roles money. Market enthusiasts often overlook the importance of money, focusing instead on the behaviors of market participants. But money has proved to be central to market activities.
Summary
This essay explores the concept of markets in economics, highlighting their characteristics, the role of the price system, and the shift towards a mathematical understanding of markets with the concepts of equilibrium and marginal analysis. It also discusses the strengths and weaknesses of the market system, including its potential to enhance inequality, its amoral nature, and its limitations in meeting social and democratic needs.
The essay begins by defining markets as mechanisms that facilitate the exchange between buyers and sellers, emphasizing that they are social technologies that need to be created and managed. It then discusses the characteristics of markets, such as voluntary exchange, competition, and the use of a mutually acceptable means of payment.
The essay then delves into the price system, explaining how prices are determined by supply and demand and how they act as signals of scarcity and abundance. It also provides examples of dynamic pricing systems used by companies like Amazon.
It then discusses the shift from political economy to neoclassical economics, highlighting the contributions of William Stanley Jevons and Alfred Marshall in developing the concepts of equilibrium price and marginal analysis. This shift led to a more mathematical and technical approach to economics, focusing on market mechanics rather than broader social and political factors.
Finally, the essay evaluates the strengths and weaknesses of the market system, drawing primarily on the work of David Croteau and William Hoynes. It discusses the efficiency, responsiveness, flexibility, and innovation fostered by markets, but also acknowledges their potential to enhance inequality, their amoral nature, and their limitations in meeting social and democratic needs.
In summary, the essay provides an overview of the concept of markets in economics, highlighting their characteristics, the role of the price system, the shift towards a mathematical understanding of markets, as well as the ongoing debate about their strengths and weaknesses.
Notes
[1] Jevons, W. S. (1871) The Theory of Political Economy. Macmillan and Co.
[2] Marshall, A. (1890) Principles of Economics. Macmillan and Co.
[3] Croteau, D. and Hoynes, W. (2006) The Business of Media: Corporate Media and the Public Interest (2006).
Citation APA (7th Edition)
Pennings, A.J. (2025, Feb 23) Markets and Prices: Pros, Cons. apennings.com https://apennings.com/dystopian-economies/markets-and-prices-pros-cons/
© ALL RIGHTS RESERVED
Anthony J. Pennings, PhD is a professor in the Department of Technology and Society, State University of New York, Korea and holds a joint appointment as Research Professor at Stony Brook University. He teaches AI policy and digital economics. From 2002-2012, he taught digital media economics and information systems management at New York University. He also taught in the MBA program at St. Edwards University in Austin, Texas, where he lives when not in Korea.
Tags: Alfred Marshall > Bloomberg box > Reuters Monitor > William Stanley Jevons
AI and Government: Concerns Shaped from Classic Public Administration Writings
Posted on | February 9, 2025 | No Comments
Recent events in US politics have highlighted tensions over our conception of government, the role of business in public affairs, and even how artificial intelligence (AI) should be used in the bureaucratic systems of the US federal system. This post covers some of the primary reasons why government, even in its search for efficiency, differs from business by drawing on historical writings in public administration. Insights from these analyses can start to specify some constraints and goals for government AI systems so that they are designed to be transparent, explainable, and regularly audited to ensure fairness, avoid bias and discrimination, and protect citizen privacy. This means that the data used, the algorithms employed, and the reasoning behind decisions should be clear and understandable to human overseers and the public. This is crucial for accountability and building trust in governmental AI mechanisms.
Public administration is the art and science of managing public programs and policies and coordinating bureaucratic strategies and public affairs. Public administration was an important part of my PhD in Political Science, and I was particularly interested in the role of information technology (IT) and networking, including its use in financial tasks. As we move forward with IT and even AI in government, it is critical that they be designed and programmed with ideals gleaned from years of public administration deliberations.
The debate over whether government should be run like a business has been a long-standing issue in public administration. The historical writings of public administration offer compelling reasons why government is fundamentally different from business. Scholars such as Paul Appleby, Harland Cleveland, Dwight Waldo, Max Weber, and even US President Woodrow Wilson have articulated key differences between government and business, emphasizing the distinct purposes, structures, and constraints that define the public administration of government. Also important is the role of politics, a fundamental component of the democratic agenda, but one that is not always conducive to efficiencies and values present in the private sector.
This post covers some of the primary reasons why government differs from business, drawing on historical writings in public administration, including political constraints, public interest vs. profit maximization, accountability and transparency, decision-making and efficiency constraints, monopoly vs. market competition, legal and ethical constraints, and distinctions between service vs. the consumer model.
By carefully considering these challenges and drawing on the wisdom of the classics of public administration, it may be possible to start to train the power of AI to create “smart” but ethical government systems that serve the public interest and promote the well-being of all citizens. Currently, the Trump administration with Elon Musk seems to be building a “digital twin” of the payment system at the Treasury and other parts of the administrative heart of the US government, probably in the new datacenter called Colussus built in Memphis.
Digital twins are a powerful tool for training AI models as they can help to generate data, simulate scenarios, and explain AI models. It mimics current systems as it trains a new AI engine with the goal of developing new types of digital bureaucracies and services. As digital twin technology develops with faster chips and larger data centers, it will likely play an even greater role in training AI government models. This innovation is new and unprecedented and should only be pursued with the highest intentions and a solid basis in democratic and public administration understanding.
Political Constraints and Efficient Bureaucracies
Woodrow Wilson (1887), in “The Study of Administration,” addressed the issue of government efficiency and argued that public administration should be distinct from politics. For him, government is ultimately driven by the public good, not financial gain. He emphasized the need for a professional and efficient bureaucracy to implement public policy. Wilson’s emphasis on the separation of politics and administration highlighted the need for a professional and impartial bureaucracy.
Paul Appleby (1945) reinforced this position by stating that government serves a broad public interest rather than a select group of stakeholders. Government’s core purpose is to serve the public interest and promote the general welfare of society. This includes providing essential services, protecting citizens, and promoting social equity.
Governments often operate with a longer-term perspective, considering the needs of future generations and the long-term sustainability of policies and programs. Businesses, while also concerned with long-term success, often prioritize shorter-term financial goals. Businesses prioritize profit, efficiency, and shareholder value, whereas governments must balance equity, justice, and service delivery even when it’s not profitable (e.g., social security, public education). For example: The government provides social services like healthcare for seniors, unemployment reflief, and welfare, which businesses would find unprofitable.
Businesses are legally required to maximize profits for their shareholders. In contrast, government’s core purpose is to serve the public interest and promote the general welfare of society. This includes providing essential services, protecting citizens, and promoting social equity. By keeping Appleby’s insight at the forefront, AI development in government can be guided by a commitment to serving the broad public interest and strengthening democratic values.
Accountability, Transparency, and Legitimacy
Max Weber emphasized that government agencies operate under legal-rational authority, meaning they follow laws, regulations, and procedures that are meant to ensure transparency and accountability. Businesses operate under market competition and corporate governance, where decisions can be made with greater discretion without public oversight. Weber’s work on bureaucracy underscores the importance of formal rules, clear procedures, and hierarchical structures in government organizations. This translates to AI systems needing well-defined architectures, clear lines of authority for decision-making, and specific functions for each component. These frameworks may ensure accountability and prevent AI from overstepping its intended role.
In his seminal work, Economy and Society (1922), Weber articulated fundamental differences between government and business.
His analysis highlighted the structural, operational, and accountability-based distinctions between the two domains. He distinguished government from business in several ways: Government bureaucracy operate under legal authority, meaning it follows a fixed set of laws and regulations. Business bureaucracy is primarily driven by profit motives and market competition, with more flexibility in decision-making. Government officials also follow formal rules and legal mandates, while business executives can make discretionary decisions based on market conditions. For example: A government agency must adhere to strict procurement laws when purchasing supplies, whereas a business can choose vendors based on cost efficiency alone.
Dwight Waldo (1948) in The Administrative State highlighted that government accountability is complex because it must answer to multiple stakeholders (citizens, courts, legislatures), unlike businesses that primarily answer to investors. For example, governments hold public hearings and legislative reviews before making budgetary decisions, whereas businesses do not require public approval before adjusting financial strategies.
Waldo challenged the traditional view that public administration could be purely technical and neutral. Governments are accountable to the public and operate under greater transparency requirements than businesses. This includes open records laws, public hearings, and legislative oversight. Public officials are also held to higher ethical standards than private sector employees, with expectations of impartiality, fairness, and integrity in their decision-making.
Waldo argued that bureaucracy is not just an administrative tool but a political institution, shaped by values, ideologies, and democratic principles. This makes accountability more complex than in business, where efficiency and profit are the primary concerns. His main points were:
– Bureaucracy is inherently political, not just administrative.
– Government agencies must answer to multiple, often conflicting, stakeholders.
– Bureaucratic power must be controlled through democratic institutions.
– Efficiency must be balanced with justice, ethics, and public values.
Governments possess coercive power, including the ability to tax, regulate, and enforce laws. Businesses, while also subject to regulations, primarily rely on market forces and voluntary transactions. Governments derive their legitimacy from democratic processes and the consent of the governed. Businesses, while also subject to societal expectations, primarily focus on satisfying customer demand and generating profits for investors.
Decision-Making and Efficiency Constraints
Herbert Simon (1947) in Administrative Behavior introduced the concept of “bounded rationality,” challenging the notion of perfect rationality in decision-making and explaining that government decisions are constrained by political pressures, competing interests, and complex regulatory environments.
Bounded rationality is often considered a more realistic model of human decision-making in organizations, recognizing the inherent limitations individuals face. Understanding bounded rationality can inform organizational design, promoting structures and processes that support effective decision-making within these constraints. Developing decision support tools and technologies can help overcome some of the limitations of bounded rationality, providing decision-makers with better information and analysis.
This concept recognizes that individuals, particularly in organizational settings, face inherent limitations preventing them from making perfectly rational decisions. These include limitations due to limited cognitive capacity and the inability to process all available information or consider every possible alternative when making decisions. Decision-makers also lack complete information about the situations, the potential consequences of their choices, or the preferences of others involved. Individuals are also prone to cognitive biases, such as confirmation bias (seeking information that confirms existing beliefs) and anchoring bias (over-relying on the first piece of information received), which can distort their judgment.
Simon argued that officials often “satisfice” instead of optimize. They make “good enough decisions” due to these limitations. They often choose the first option that meets their minimum criteria, rather than searching for the absolute best solution. Satisficing is often a more efficient approach, as it conserves cognitive resources and allows for quicker decision-making. However, it may not always lead to the optimal outcome.
By acknowledging the limitations of human rationality and designing AI systems that work within those constraints, governments can leverage AI to make more informed, efficient, and effective decisions. It’s about creating AI that assists human decision-makers in navigating the complexities of the real world, rather than attempting to achieve an unrealistic ideal of perfect rationality.
By acknowledging the limitations of human rationality and designing AI systems that work within those constraints, governments can leverage AI to make more informed, efficient, and effective decisions. It’s about creating AI mechanisms that assist human decision-makers in navigating the complexities of the “real world,” rather than attempting to achieve an unrealistic ideal of perfect rationality.
Philip Selznick (1949) in TVA and the Grass Roots conducted an important case study that showed how government decision-making is influenced by political negotiation and social considerations rather than just economic rationality. It challenged the traditional view of bureaucracy as a purely neutral and rational system. Instead, Selznick demonstrated that bureaucratic organizations are deeply political and shaped by social forces. His analysis of the Tennessee Valley Authority (TVA) revealed how local power dynamics, institutional culture, and informal relationships influence public administration.
The TVA, was a New Deal-era federal agency created in 1933 to promote regional economic development through infrastructure projects like dams and electricity generation. The TVA was originally designed as an apolitical, technocratic institution that would implement policy based on expertise rather than political considerations.
However, Selznick’s study showed that the TVA had to negotiate with local elites, businesses, and community groups to gain support for its programs. Rather than being a neutral bureaucracy, the TVA absorbed the interests and values of local stakeholders over time.
Political compromises often weakened the agency’s original mission of social reform and economic equality. For example, the TVA partnered with local conservative agricultural interests, even though these groups resisted social reforms that would have empowered poor farmers.
Selznick introduced the concept of “co-optation, which describes how bureaucratic organizations incorporate external groups to maintain stability and legitimacy. Instead of enforcing policies rigidly, agencies often have to adjust their goals to align with influential local actors. Co-optation helps agencies gain support and avoid resistance, but it can also dilute their original purpose. This explains why public organizations often fail to deliver radical change, even when they are designed to do so. For example, the TVA originally aimed to empower small farmers and promote land reform, but over time, it aligned itself with local business leaders and preserved existing power structures instead.
By embracing the principles of co-optation, governments can develop AI systems that serve the broader public interest and that development is guided by community engagement, transparency, and collaboration. AI development in government should involve active engagement with a wide range of stakeholders, including citizens, community groups, experts, and advocacy organizations. Co-optation can be used to address concerns and objections raised by external groups. By incorporating their feedback and making adjustments to AI systems, governments can mitigate potential opposition and build consensus.
Monopoly vs. Market Competition
Governments often hold a monopoly over essential services (e.g., national defense, law enforcement, public infrastructure) where competition is neither feasible nor desirable. Governments have broader responsibilities than businesses, encompassing national defense, social welfare, environmental protection, and infrastructure development. Technological changes, however, can change the dynamics of specific utilities. Telecommunications, for example, were primarily government-run facilities that worked to ensure universal service. To upgrade to the global Internet, however, these operations were largely deregulated or sold off to the private sector to invest in innovative new services. More recent discussions have pointed to “net neutrality” and even “cloud neutrality” to address the monopolization of services at the Internet’s edge, such as AI.
Leonard White (1926) in Introduction to the Study of Public Administration pointed out that government agencies do not face direct market competition, which affects incentives and operational efficiency. In contrast, businesses operate in a competitive market where consumer choice determines success. For example, the police department does not compete with private security firms in the way that Apple competes with Samsung in the smartphone market.
White also believed that public administration is the process of enforcing or fulfilling public policy. Since profit is not the primary goal, it’s crucial to define what constitutes “success” for AI systems in government. This might include citizen satisfaction, efficiency gains, improved outcomes, or reduced costs. By carefully considering the unique dynamics of government agencies and incorporating AI in a way that addresses the challenges of limited market feedback and different incentive structures, governments can leverage AI to create more effective, responsive, and citizen-centric services.
Legal and Ethical Constraints
Governments must operate under constitutional and legal constraints, ensuring adherence to democratic principles and human rights. Frank Goodnow (1900) in Politics and Administration argued that public administration is shaped by legal frameworks and public policy goals rather than market forces.
Public officials must follow strict ethical codes and conflict-of-interest regulations that go beyond corporate ethics policies. For example, a government agency should not arbitrarily cut services to boost its budget surplus, whereas a corporation can cut unprofitable product lines without legal repercussions.
Goodnow was one of the first scholars to formally separate “politics” from “administration,” arguing that politics involves the creation of laws and policies through elected representatives. Administration is the implementation of those laws and policies by bureaucratic agencies. Public administration should be neutral, professional, and guided by legal rules, rather than influenced by political pressures.
For example, Congress (politics) passes a law to regulate environmental pollution, and the Environmental Protection Agency (EPA) or the Federal Communications Commission (FCC) (administration) enforces and implements their laws and regulations through technical expertise and bureaucratic processes. Goodnow emphasized that public administration derives its legitimacy from legal and constitutional frameworks, not from market competition.
He argued that government agencies must operate within the rule of law, ensuring fairness, justice, and accountability. Laws define the scope of administrative power, unlike businesses that act based on profit incentives. Bureaucrats should be trained professionals who follow legal principles rather than respond to political or market forces. A tax agency must enforce tax laws uniformly, even if doing so is inefficient, whereas a private company can adjust its pricing strategies according to profit strategies.
Unlike businesses, which prioritize efficiency and profitability, Goodnow argued that government agencies serve the public interest. They provide services that markets might ignore (e.g., public health, education, law enforcement). Public agencies must prioritize equity, justice, and democratic values rather than cost-cutting. The effectiveness of government is measured not just by efficiency but by fairness and public trust. For example, governments fund public schools to ensure universal education, even if private schools might cater to specific family or community preferences.
By adhering to strict ethical principles and conflict-of-interest regulations, governments can ensure that AI is used in a way that builds trust, promotes fairness, and serves the public interest. It’s about creating AI systems that are not only effective but also ethical and accountable.
Service vs. Consumer Model
Citizens are not “customers” in the traditional sense because they do not “choose” whether to participate in government services (e.g., paying taxes, following laws). Harlan Cleveland, a distinguished diplomat and President of the University of Hawaii in his later years argued in his (1965) article “The Obligations of Public Power,” that public administration must ensure universal access to critical services, regardless of financial status. Businesses, on the other hand, serve paying customers and can exclude non-paying individuals from services. For example, a government hospital must treat all patients, including those who cannot afford to pay, whereas a private hospital can refuse service based on financial capacity.
His arguments focused on the ethical, political, and practical challenges faced by government officials in wielding public power. The ethical responsibility of public officials included holding power on behalf of the people, meaning they must act with integrity and accountability. Cleveland warned against abuse of power and the temptation for bureaucrats to act in self-interest rather than the public good. He stressed the need for ethical decision-making in government to prevent corruption and misuse of authority. For example, a government official responsible for allocating funds must ensure fairness and avoid favoritism, even when pressured by political influences.
Public administration should strive to be effective but must not sacrifice democratic values to pursue efficiency. He argued that bureaucratic decision-making should be transparent and participatory, ensuring citizens have a voice in government actions. Efficiency is important, but equity, justice, and citizen involvement are equally critical. For example, government programs should not cut social programs simply because they are expensive—public welfare must be prioritized alongside financial considerations.
Cleveland emphasized that public power must be answerable to multiple stakeholders, including the public (through elections and civic engagement), legislatures (through oversight and funding), and the courts (through legal constraints and judicial review). Unlike businesses, which are accountable mainly to shareholders, government agencies must navigate complex and often conflicting demands from different groups. For example, a public health agency must justify its policies to elected officials (who determine budgets) and citizens (who expect effective services).
Cleveland also pointed to the growing complexity of governance, a term he was one of the first to use. Government agencies were becoming more complex and specialized, requiring public administrators to manage technological advancements and expanding regulations as well as international relations and globalization. Cleveland worried that bureaucracies might become too rigid and disconnected from the people, creating a gap between government and citizens.
By keeping Cleveland’s principle at the forefront, governments can leverage AI to create a more just and equitable society where everyone has access to the services they need to thrive. It’s about using technology to empower individuals, reduce disparities, and ensure that everyone has the opportunity to reach their full potential.
As government agencies adopt AI and data-driven decision-making, they must ensure that technology serves human interests and does not lead to excessive bureaucracy or loss of personal agency. Cleveland called for adaptive, innovative leadership in public administration to keep up with social, political, and technological changes. He criticized government agencies that resist reform or fail to evolve with society’s needs. Public administrators must be proactive, responsive, and forward-thinking rather than merely following routine procedures. For example, climate change policies require public agencies to anticipate future risks, rather than simply reacting to disasters after they occur.
For Cleveland, public service was a moral obligation, not just a technical or managerial function. He believed that serving the public is an ethical duty, requiring commitment to justice, fairness, and the common good. Bureaucrats must see themselves as stewards of public trust, not just rule enforcers.
Harlan Cleveland’s emphasis on universal access to critical services, regardless of financial status, is a fundamental principle that must guide the design of AI mechanisms in government. Cleveland argued that public administration, unlike business, has a fundamental obligation to serve all citizens regardless of their ability to pay, and must balance efficiency with democratic values like equity, justice, and citizen participation. He stressed the ethical responsibility of public officials to act in the public interest, be accountable to multiple stakeholders, and adapt to the growing complexity of governance.
These principles are crucial for guiding AI development in government. AI systems should be designed provide universal access to critical services, overcoming barriers like financial constraints, location, and digital literacy. AI systems should avoid sacrificing democratic values in the pursuit of efficiency while maintaining transparency and accountability, allowing citizens to understand and participate in AI-driven decision-making. Ultimately, AI in government should be a tool for enhancing public service and promoting the common good, not just a means to increase efficiency.
Conclusion: The Unique Role of Government and the Implications of AI
Public administration scholars have consistently emphasized that government is not simply a business; it operates under different principles, constraints, and objectives. While efficiency is valuable, the government’s primary goal is to serve the public good, uphold democracy, and ensure fairness and justice, even at the cost of financial efficiency. The writings of Appleby, Cleveland, Waldo, Weber, and Wilson, continue to reinforce the fundamental distinction between governance and business management.
Drawing on the classics of public administration, we can start to specify some constraints and goals for artificial intelligence (AI) and develop a “smart” but ethical government that is efficient but also responsive to public concerns.
Possibilities and Oversight
– AI systems used in government should be transparent, with open access to the data and algorithms used to make decisions. This allows for public scrutiny and accountability.
– Regular audits and oversight of AI systems are vital to ensure they function as intended and do not produce unintended consequences.
– AI systems should be designed to protect the privacy of citizens and ensure that their data is used responsibly and ethically.
– While AI can automate many tasks, human oversight is essential to ensure that AI systems are used in a way that aligns with ethical principles and societal values.
– AI can make government information more accessible to citizens, providing clear and concise explanations of policies and programs.
– AI can gather and analyze citizen feedback, providing valuable insights for policymaking and service delivery.
– AI can facilitate participatory governance, enabling citizens to contribute to decision-making processes and shape public policy.
Challenges and Considerations
– AI systems can perpetuate existing biases if not carefully designed and monitored. It’s essential to ensure that AI systems are fair and non-discriminatory.
– The automation of specific government tasks may lead to job displacement. It’s important to develop strategies for workforce transition and retraining.
– Building and maintaining public trust in AI is crucial for its successful adoption in government. This implementation requires a commitment to transparency, explainability, and accountability in all AI-related processes and decisions.
By carefully considering these opportunities and challenges and drawing on the wisdom of the classics of public administration, we can start to harness the power of AI to create a “smart” but ethical government that serves the public interest and promotes the well-being of all citizens. In future posts, I plan to draw on subsequent generations of public administration practitioners and scholars who provide more critical perspectives of more complex government structures that have emerged in the last century. Women’s voices, such as Kathy Ferguson’s critique of bureaucracy and Stephanie Kelton’s critique of government budgeting, are extremely valuable perspectives going forward. AI is undoubtedly on the near horizon for government services, and it should be approached with the understanding that such systems are capable, but not guaranteed, of being designed for the public good.
Citation APA (7th Edition)
Pennings, A.J. (2025, Feb 09) AI and Government: Concerns from Classic Public Administration Writings. apennings.com https://apennings.com/digital-geography/ai-and-government-concerns-from-classic-public-administration-writings/
Bibliography
Appleby, P. H. (1945). Big Democracy. Alfred A. Knopf.
Cleveland, H. (1965). The Obligations of Public Power. Public Administration Review, 25(1), 1–6.
Ferguson, Kathy (1984). The Feminist Case Against Bureaucracy. Temple University Press.
Goodnow, F. J. (1900). Politics and Administration: A Study in Government. Macmillan.
Kelton, Stephanie. (2020) “The Deficit Myth: Modern Monetary Theory and the Birth of the People’s Economy.” PublicAffairs.
Selznick, P. (1949). TVA and the Grass Roots: A Study in the Sociology of Formal Organization. University of California Press.
Simon, H. A. (1947). Administrative Behavior: A Study of Decision-Making Processes in Administrative Organizations. Macmillan.
Waldo, D. (1948). The Administrative State: A Study of the Political Theory of American Public Administration. Ronald Press.
Weber, M. (1922). Economy and Society: An Outline of Interpretive Sociology (G. Roth & C. Wittich, Eds.). University of California Press.
White, L. D. (1926). Introduction to the Study of Public Administration. Macmillan.
Wilson, W. (1887). The Study of Administration. Political Science Quarterly, 2(2), 197–222. https://doi.org/10.2307/2139277
Note: Several AI requests were prompted and parsed for this post.
© ALL RIGHTS RESERVED
Anthony J. Pennings, PhD is a Professor at the Department of Technology and Society, State University of New York, Korea and a Research Professor for Stony Brook University. He teaches AI policy and engineering economics. From 2002-2012 he taught digital economics and information systems management at New York University. He also taught in the Digital Media MBA at St. Edwards University in Austin, Texas, where he lives when not in Korea.
Tags: bounded rationality > Dwight Waldo > Harland Cleveland > Herbert Simon > Max Weber > Paul Appleby > Philip Selznick > Tennessee Valley Authority (TVA) > Woodrow Wilson
AI Governance and the Public Management of Transportation
Posted on | February 6, 2025 | No Comments
I’m doing an audit of my work on the topic of AI Governance of the Automatrix for publication. It’s my collection of posts on Artificial Intelligence (AI) Governance and the Automatrix or maybe “Robomatrix?” It is about the public management of the future transportation infrastructure as it becomes increasingly “smart” and electric.

Pennings, A.J. (2025, Feb 09) AI and Government: Concerns from Classic Public Administration Writings. apennings.com https://apennings.com/digital-geography/ai-and-government-concerns-from-classic-public-administration-writings/
Pennings, A.J. (2024, Nov 21) Google: Monetizing the Automatrix – Rerun. apennings.com https://apennings.com/global-e-commerce/google-monetizing-the-automatrix-2/
Pennings, A.J. (2024, Oct 10). All Watched over by Systems of Loving Grace. apennings.com https://apennings.com/how-it-came-to-rule-the-world/all-watched-over-by-systems-of-loving-grace/
Pennings, A.J. (2024, Jun 24). AI and Remote Sensing for Monitoring Landslides and Flooding. apennings.com https://apennings.com/space-systems/ai-and-remote-sensing-for-monitoring-landslides-and-flooding/
Pennings, A.J. (2024, Jun 22). AI and the Rise of Networked Robotics. apennings.com https://apennings.com/technologies-of-meaning/the-value-of-science-technology-and-society-studies-sts/
Pennings, A.J. (2024, Jan 19). How Do Artificial Intelligence and Big Data Use APIs and Web Scraping to Collect Data? Implications for Net Neutrality. apennings.com https://apennings.com/technologies-of-meaning/how-do-artificial-intelligence-and-big-data-use-apis-and-web-scraping-to-collect-data-implications-for-net-neutrality/
Pennings, A.J. (2024, Jan 15). Networking Connected Cars in the Automatrix. apennings.com https://apennings.com/telecom-policy/networking-in-the-automatrix/
Pennings, A.J. (2022, Apr 22). Wireless Charging Infrastructure for EVs: Snack and Sell? apennings.com https://apennings.com/mobile-technologies/wireless-charging-infrastructure-for-evs-snack-and-sell/
Pennings, A.J. (2019, Nov 26). The CDA’s Section 230: How Facebook and other ISPs became Exempt from Third Party Content Liabilities. apennings.com https://apennings.com/telecom-policy/the-cdas-section-230-how-facebook-and-other-isps-became-exempt-from-third-party-content-liabilities/
Pennings, A.J. (2021, Oct 14). Hypertext, Ad Inventory, and the Use of Behavioral Data. apennings.com https://apennings.com/global-e-commerce/hypertext-ad-inventory-and-the-production-of-behavioral-data/

Pennings, A.J. (2012, Nov 8) Google, You Can Drive My Car. apennings.com https://apennings.com/mobile-technologies/google-you-can-drive-my-car/
Pennings, A.J. (2014, May 28) Google, You Can Fly My Car. apennings.com https://apennings.com/ditigal_destruction/disruption/google-you-can-fly-my-car/
Pennings, A.J. (2020, Feb 9). It’s the Infrastructure, Stupid. apennings.com https://apennings.com/democratic-political-economies/from-new-deal-to-green-new-deal-part-3-its-the-infrastructure-stupid/
Pennings, A.J. (2010, Nov 20). How “STAR WARS” and the Japanese Artificial Intelligence (AI) Threat Led to the Internet. apennings.com https://apennings.com/how-it-came-to-rule-the-world/star-wars-creates-the-internet/
Pennings, A.J. (2018, Sep 27) How “STAR WARS” and the Japanese Artificial Intelligence (AI) Threat Led to the Internet, Part II. apennings.com https://apennings.com/how-it-came-to-rule-the-world/how-star-wars-and-the-japanese-artificial-intelligence-ai-threat-led-to-the-internet-japan/
Pennings, A.J. (2011, Jan 2) How “STAR WARS” and the Japanese Artificial Intelligence (AI) Threat Led to the Internet, Part III: NSFNET and the Atari Democrats. apennings.com https://apennings.com/how-it-came-to-rule-the-world/how-%e2%80%9cstar-wars%e2%80%9d-and-the-japanese-artificial-intelligence-ai-threat-led-to-the-internet-part-iii-nsfnet-and-the-atari-democrats/
Pennings, A.J. (2017, Mar 23) How “STAR WARS” and the Japanese Artificial Intelligence (AI) Threat Led to the Internet, Part IV: Al Gore and the Internet. apennings.com https://apennings.com/how-it-came-to-rule-the-world/how-%e2%80%9cstar-wars%e2%80%9d-and-the-japanese-artificial-intelligence-ai-threat-led-to-the-internet-al-gor/
Pennings, A.J. (2014, Nov 11). IBM’s Watson AI Targets Healthcare. apennings.com https://apennings.com/data-analytics-and-meaning/ibms-watson-ai-targets-healthcare/
Pennings, A.J. (2011, Jun 19) All Watched Over by Machines of Loving Grace – The Poem. apennings.com https://apennings.com/how-it-came-to-rule-the-world/all-watched-over-by-machines-of-loving-grace-the-poem/
Pennings, A.J. (2011, Dec 04) The New Frontier of “Big Data”. apennings.com https://apennings.com/technologies-of-meaning/the-new-frontier-of-big-data/
Pennings, A.J. (2013, Feb 15). Working Big Data – Hadoop and the Transformation of Data Processing. apennings.com https://apennings.com/data-analytics-and-meaning/working-big-data-hadoop-and-the-transformation-of-data-processing/
Pennings, A.J. (2014, Aug 30) Management and the Abstraction of Workplace Knowledge into Big Data. apennings.com https://apennings.com/technologies-of-meaning/management-and-the-abstraction-of-knowledge/
Pennings, A.J. (2021, Oct 14). Hypertext, Ad Inventory, and the Use of Behavioral Data. apennings.com https://apennings.com/global-e-commerce/hypertext-ad-inventory-and-the-production-of-behavioral-data/
Anthony J. Pennings, PhD is a Professor at the Department of Technology and Society, State University of New York, Korea, teaching financial economics and ICT for sustainable development, holding a joint appointment as a Research Professor at Stony Brook University. From 2002 to 2012, he was on the faculty of New York University, where he taught digital economics and information systems management. When not in Korea, he lives in Austin, Texas.
Citation APA (7th Edition)
Pennings, A.J. (2025, Feb 6) AI Governance and the Public Management of Transportationapennings.com https://apennings.com/digital-coordination/ai-governance-and-the-public-management-of-transportation/
© ALL RIGHTS RESERVED
Anthony J. Pennings, PhD is a Professor at the Department of Technology and Society, State University of New York, Korea with a joint appointment at Stony Brook University as a Research Professor. He teaches AI policy and ICT for sustainable development. From 2002-2012 he taught digital economics and information systems management at New York University. He also taught in the Digital Media MBA at St. Edwards University in Austin, Texas, where he lives when not in the Republic of Korea.
Tags: Artificial Intelligence (AI) > Connected Cars
Referencing this Material
About Me
Professor at State University of New York (SUNY) Korea since 2016. Moved to Austin, Texas in August 2012 to join the Digital Media Management program at St. Edwards University. Spent the previous decade on the faculty at New York University teaching and researching information systems, digital economics, and strategic communications.
You can reach me at:
apennings70@gmail.com
anthony.pennings@sunykorea.ac.kr

About me
Writings by Category
- artificial intelligence
- automatrix
- books and films
- characteristics of digital media
- creative cities
- creative industries
- crisis communications
- cultural Industries
- data analytics and meaning
- democratic political economies
- digital coordination
- digital destruction
- digital geography
- digital media economics
- digital media management
- digital monetarism
- digital spreadsheets
- disruption
- dystopian economies
- educational innovations
- electric money
- enabling frameworks
- enterprise systems
- financial news
- financial technology
- food policy and security
- futurists
- geopolitical risk
- global communications
- global e-commerce
- health IT
- how IT came to rule the world
- intellectual property
- journalism
- meaning makers
- meaningful play
- media strategies
- mobile technologies
- multimedia
- political economies in sf
- political economy of media
- science and technology studies
- sensing technologies
- smart new deal
- social media
- space systems
- strategic communications
- sustainable development
- technologies of meaning
- technology management
- telecom policy and net neutrality
- telegraphic political economy
- telelearn/telework
- the cold war
- the smith effect
- uncategorized
- visual literacy and rhetoric
Pages
Calendar
| M | T | W | T | F | S | S |
|---|---|---|---|---|---|---|
| 1 | 2 | 3 | 4 | 5 | 6 | |
| 7 | 8 | 9 | 10 | 11 | 12 | 13 |
| 14 | 15 | 16 | 17 | 18 | 19 | 20 |
| 21 | 22 | 23 | 24 | 25 | 26 | 27 |
| 28 | 29 | 30 | 31 | |||